| Professional charting tools for .Net developers |
Introducing SharpPlot
Your First Chart
Recent Updates
Tutorials
General Tutorials
Chart Tutorials
Reference
SharpPlot Class
Properties
Methods
Structures
Enumerations
Style examples
Glossaries
Active Charts
VectorMath Class
DBUtil Class
Get SharpPlot
Download SharpPlot
Buying SharpPlot
SharpPlot Support
Upgrading from GraPL
Release notes
Home > Sample Charts > CloudChart > Trend surface with contour lines
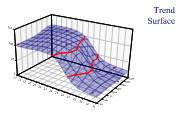
Trend surface with contour lines
The Cloud chart is essentially a scatter-plot in 3 dimensions (maybe you are running an experiment in which you vary pressure and temperature, and are interested in the yield of the result). Rather than fitting a line to show the relationship between input and output, you fit a plane (if the data is linear in both x and y) or a curved surface.
This example shows the analagous style to the ‘trendline’ available in the ScatterPlot. The surface is a gaussian-weighted smooth which can be controlled with the Flexibility property. With so few points, the sample sets the flex very low indeed, as otherwise the surface would resemble a series of plateaux around each point. With a realistically large data array (probably several hundred points) the default flexibility would be more suitable.
Contour lines are drawn at each Z-axis tickmark, and the ‘grid’ is computed at the intersection of each x-y tick. The MeshDensity property can be used to add more points into the mesh to make a smoother surface.
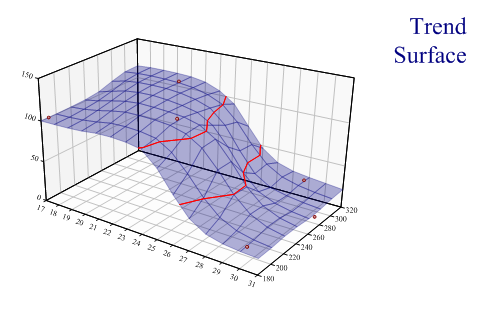
SharpPlot sp = new SharpPlot;
sp.SetMargins(24,32,18,6);

zdata = new int[] {100,15,27,117,19,112};
xdata = new int[] {17,31,29,21,30,24};
ydata = new int[] {190,270,310,300,190,230};

sp.Heading = "Trend\nSurface";
sp.HeadingStyle = HeadingStyles.Right;

sp.SetZTickMarks(50);  // Contour interval also

sp.CloudChartStyle = CloudChartStyles.WallShading|CloudChartStyles.TrendSurface|
         CloudChartStyles.Contours|CloudChartStyles.GridLines|
         CloudChartStyles.TiledSurface;

sp.Flexibility = 1;
sp.ZAxisStyle = ZAxisStyles.ForceZero;
sp.YAxisStyle = YAxisStyles.FlatText;
sp.SetFillStyles(FillStyle.Opacity30);
sp.SetPenWidths(0.8);

sp.SetMarkers(Marker.Node);
sp.DrawCloudChart(xdata,ydata,zdata);
Worked Examples
 |
 |
 |
 |