| Professional charting tools for .Net developers |
Introducing SharpPlot
Your First Chart
Sample Charts
Tutorials
General Tutorials
Chart Tutorials
Reference
SharpPlot Class
Properties
Methods
Structures
Enumerations
Style examples
Glossaries
Active Charts
VectorMath Class
DBUtil Class
Get SharpPlot
Download SharpPlot
Buying SharpPlot
SharpPlot Support
Upgrading from GraPL
Release notes
Home > Recent Updates
Recent Updates
Rendering improvements
The range of supported image formats has been greatly extended (see the .Net documentation on the Bitmap class) and the quality now matches the best of the Vector formats. Gradient fills, transparency and anti-aliasing are all fully supported. To go with the improved raster support, SharpPlot now offers the option to render to an image-map which allows raster charts to support hyperlinks, hints, tips and simple Javascript handlers in the same way as VML and SVG.
The ‘metafile’ format supported by .Net is also much improved, and allows charts rendered as metafile objects to be saved to disk and imported into Word or PowerPoint without loss of quality. An application can use the standard PictureBox control to display the final image, and make use of the PageMap class to enable mouse-tracking, drill-down and graphical manipulation of the data.
SilverLight support
RenderXaml and SaveXaml will export your chart in a form suitable for the SilverLight plugin. It is likely that the XAML support will be extended in future as the SilverLight plugin adds more capabilities.
Synchronised and Balanced Y-axes
New axis style Synch will force the tickmarks of a secondary axis to mate up nicely with the primary, so it can share a common set of gridlines. Related feature is axis style Balanced which forces matching numbers of ticks above and below the axis which is always set at the zero point.

Custom tickmarks
Detailed control over tick-mark length to allow complex time-series to define a hierarchy of time-periods (months, quarters etc). This goes along with the newly added ability to ‘span’ X-axis labels to make for a much more flexible labelling scheme.
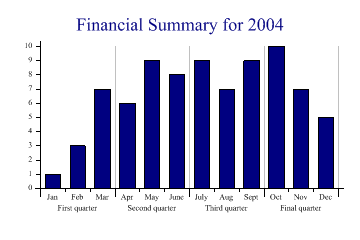
Note that the major tickmarks have been set to 150% or 50% of standard, and the default XTickThreshold has had the effect of eliminating the gridlines at the smaller ticks.
data = new int[] {1,3,7,6,9,8,9,7,9,10,7,5};
xticks = new int[] {150,50,50};  // X-ticks relative to standard (repeated as needed)
xlabs = new string[]{"Jan\nFirst quarter","Feb\nFirst quarter", ... ,"Dec\nFinal quarter"};
sp.LabelLineSpacing = 140;
By combining the varied tick lengths with spanned labels, it is possible to represent any reasonable combination of time periods.
CMYK colour model for PostScript devices
Direct control of printer ink proportions is now supported. This works by using a base-100 encoding of the 4 ink proportions, so is restricted in accuracy to 2 dec pl or integer percentages, for example:
Color orange = sp.UseCmyk(0,38,84,24);
is an orange with 24% black added. All the drivers except PostScript/PDF map these back to RGB for display using the same algorithm as GhostScript (subtractive). PS and PDF output checks for CMYK colours in the driver and calls setcmykcolor with the original 4 values. This permits the user to have exact control over the inks used by the printer.
Altitude shading
Response plots, bubblecharts and contour plots now have the option of color-coded altitude shading to represent the Z-value. A scale bar may be added to both contour plots and bubble charts to help the user interprtet the height data.
Vector Fields and Directed Graphs
This is a new chart type which can be used to plot current flows, PERT charts, or any kind of directed graph. The short tutorial has several examples.
User-defined markers
The autumn 2007 release adds the ability to specify an arbitrary path (lines or filled regions) as a graphics marker. This would allow you to create a scatterplot with (for example) chemical symbols for the various types of compound being analysed.