| Professional charting tools for .Net developers |
Introducing SharpPlot
Your First Chart
Recent Updates
Sample Charts
Tutorials
General Tutorials
Chart Tutorials
Reference
SharpPlot Class
Properties
Methods
Structures
Enumerations
Style examples
Glossaries
Active Charts
VectorMath Class
DBUtil Class
Download SharpPlot
Buying SharpPlot
SharpPlot Support
Release notes
Get SharpPlot > Upgrading from GraPL
Upgrading from GraPL
For existing users of our GraPL COM server, SharpPlot will require some major recoding. However nothing has been taken away, only the names and interface has changed to match the .Net guidelines. This topic summarises the major changes you will need to make to existing code.
Architecture changes
The first thing to note is that all the ‘charting’ calls are now prefixed with Draw, so mygrapl.Barchart becomes sp.DrawBarChart. This helps to group them together in the auto-complete dropdown in Visual Studio, as well as making it clear which calls actually ‘draw’ something and which simply set up properties.
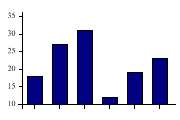
sp.SetMargins(12,12,18,4);
data = new int[] {18,27,31,12,19,23};
sp.DrawBarChart(data);
You will also note that several of these calls are bicapitalised now – not a problem in VB.Net but critical in C#, which is case-sensitive. Note that mygrapl.Null has been renamed as sp.DrawFrame to avoid the use of the keyword ‘null’ in the call.
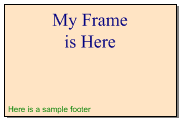
sp.SetFrameBackground(Color.Bisque,FillStyle.Solid,1);
sp.FrameStyle = FrameStyles.Boxed|FrameStyles.Shadowed|FrameStyles.Filled;
sp.Heading = "My Frame\nis Here";
sp.Footnote = "Here is a sample footer";
sp.DrawFrame();
This also illustrates the use of embedded newlines. GraPL defaulted to the semi-colon as a line-splitter in text, whereas SharpPlot always uses the industry-standard of \n or \r to mark enforced breaks in text. Just for consistency, mygrapl.YSec has also been renamed as sp.NewYAxis, as you can have as many of these as you like on one chart.
The other major change is to the way data is passed to the drawing routines. The COM server methods typically took the ‘variant’ data type, which made for easy scripting but gave no clues as to what data types would actually work correctly. It also adds a lot of internal cost in determining what data has been passed. SharpPlot methods all take strongly typed arrays, and have explicit overloads to make it clear what will work. More types may be added if users require them, for example it may make sense to allow sp.DrawTowerChart to accept matrices in addition to arrays of arrays. For now, overloads are kept to what seemed strictly necessary.
Rendering a chart no longer ‘closes’ it so you can render the same chart as many times as you need in different formats. An obvious use of this would be to make images in thumbnail form and at full size. A consequence of this is that you will need an explicit sp.Reset to clear the engine ready for a new chart.
Styles become Enums
This is likely to be the biggest coding change, in terms of the amount of typing required. In the COM server, the appearance of the chart was determined by a style property which was a simple string, such as mygrapl.style = “forcezero,markers”. This again makes for easy typing in Notepad, but of course the developer needs to know the ‘magic words’ to get the required behavior to trigger. For example to have a shaded surface, you would add style “surface” to a linegraph, but it may take a look in the documentation to discover this.
sp.LineGraphStyle = LineGraphStyles.ForceZero;
In the .Net build, all the style settings are made specific to one chart type (so rather than mygrapl.style you would have sp.BarChartStyle) and they all take options from enumerated flags of the same name. In almost all cases, the flag begins with the same four letters as the first four letters of the old style keyword, so this should make it fairly easy for existing ‘expert’ users to type them into Visual Studio and have the auto-complete finish the word. For example:
- In a linegraph, mygrapl.style = “forcezero,markers,risers” would be sp.LineGraphStyle = LineGraphStyles.ForceZero | LineGraphStyles.Markers | LineGraphStyles.Risers
- For the X-axis, mygrapl.xstyle = “grid,atend” becomes sp.XAxisStyle = XAxisStyles.Gridlines | XAxisStyles.AtendCaption
One (annoying but required) change was to remove ‘ptick’ and so on from the axis styles and make the tickmark styles a separate enumeration. Otherwise SharpPlot was in danger of breaking the recommended maximum of 32 members in a single set of flags. One or two styles have been renamed, for example ‘surface’ become Envelope for MinMax charts and ‘labmid’ becomes MiddleLabels for the X-axis. You might like to browse through the style examples and enumerations to be sure of the new names for any styles you are currently using.
Many Properties become Set Methods
The standard in .Net is to avoid defining array ‘properties’ as true Properties, but to use explicit ‘Set’ methods here. This has the advantage of allowing overloads, and explicit data-typing, A typical example might be the Datumline style:
sp.SetDatumLineStyle(Color.Maroon,new LineStyle(new int[] {12,4,24,4})); // Long dashes
Here you can give any combination of color, line-style and line-weight as strictly typed arguments.
Converting HTML-style Colors
One minor annoyance is that the .Net Color object does not recognise the HTML-style “#FFCDCC” style of defining colors. If you are using any of the well-known colors, just pass the color directly (as above). Otherwise you will need to use the ColorTranslator class to make the Color object for you:
sp.SetGridLineStyle(ColorTranslator.FromHtml("#22FFFF00"),LineStyle.Solid,2);
Note that transparency is fully supported on all lines and filled areas. The existing ‘opacity’ fill-styles will continue to be supported, but it may be easier simply to fill an area with a semi-transparent color.
Picture formatting
The GraPL formatters were almost (but not quite) exactly compatible with the C# ToString methods. In general SharpPlot just falls through to the native formatter, but we chose to work around the multiplication by 100 for a trailing % sign which would have destroyed a lot of existing code.
The only small change you may notice is that a format such as ‘###0’ will show the absolute value in GraPL and a leading minus sign in .Net. To resore the old behavior, you should change to a 2-part format such as ‘###0;###0’ which will show absolute values always.