| Professional charting tools for .Net developers |
Introducing SharpPlot
Your First Chart
Recent Updates
Sample Charts
Tutorials
General Tutorials
Chart Tutorials
SharpPlot Class
Properties
Methods
Structures
Enumerations
Style examples
Glossaries
VectorMath Class
DBUtil Class
Get SharpPlot
Download SharpPlot
Buying SharpPlot
SharpPlot Support
Upgrading from GraPL
Release notes
Reference > Active Charts
Active Charts
The PageMap class allows the programmer to explore hotspot data contained in any chart to reproduce the typical behaviour of a VML graphic deployed by a web-server.
public class PageMap
This utility class is designed to permit an application to convert mouse-tracking information into references back to the original data from which the chart was created.
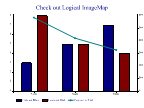
This may be used (for example) to eliminate outliers from a regression analysis or to implement data editing by allowing the user to drag markers or bars. The examples all refer to this simple chart, which has 2 data series (one with bars and one with markers) and also has a tip on the heading text.
The hotspot detail is always returned in a HotspotInfo structure which tells you all you need to know to implement a graphical enquiry or editing application.
See PageMap Introduction for a fuller description and a simple worked example.
PageMap Members
- Width Property
- The width (in points) of the paper used to draw the chart
- Height Property
- The height (in points) of the paper used to draw the chart
- PointsToAxes Method
- Convert between co-ordinate systems based on given chart, or topmost chart at this location.
- AxesToPoints Method
- Do conversion from chart axis units to points based on given chart, or last chart drawn if omitted.
- EnumerateCharts Method
- List all charts found on this page.
- FindChart Method
- Report the name of the chart at these (x,y) co-ordinates.
- FindHint Method
- Recover hint text given hotspot handle. This gets the value of any hint text set for a data value by sp.AddHints when the chart is created.
- FindHotspot Method
- Find the details of any data points on this page at given (x,y) location.
- FindHyperlink Method
- Recover link text given hotspot handle. This gets the value of any hyperlink set for a data value by sp.AddHyperlinks when the chart is created.
- FindInfo Method
- Find the details of any standard chart object(s) given the chart id and any ScriptTarget.
- FindPoints Method
- Locate all data points whose centres lie within given bounding box.
- FindScriptValue Method
- Recovers the value of any attribute set for a data value by sp.AddAttributes when the chart is created.
- FindTip Method
- Recover tip text given hotspot handle. This gets the value of any tip set for a data value by sp.AddTips when the chart is created.
- GetHotspotInfo Method
- Recover hotspot details given hotspot handle.
- GetTracker Method
- Convert points to status message giving x and y in user-space.
Requirements
Namespace: Causeway
Assembly: SharpPlot (in sharpplot.dll)