| Professional charting tools for .Net developers |
Introducing SharpPlot
Your First Chart
Recent Updates
Sample Charts
Tutorials
General Tutorials
Chart Tutorials
SharpPlot Class
Properties
Methods
Structures
Enumerations
Glossaries
Active Charts
VectorMath Class
DBUtil Class
Get SharpPlot
Download SharpPlot
Buying SharpPlot
SharpPlot Support
Upgrading from GraPL
Release notes
Reference > Style examples > Scale bar for Altitude-shaded plots
Scale bar for Altitude-shaded plots
Contour plots and 3D fitted surfaces may be ‘altitude shaded’ with a smooth gradient between given colors. This style adds a calibration bar in the right margin to allow you to read the data value from the color.
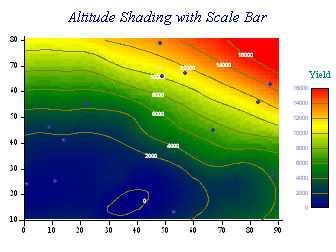
sp.ContourPlotStyle = ContourPlotStyles.ScaleBar;sp.CloudChartStyle = CloudChartStyles.ScaleBar;
The labels on the bar are written with the current Key font setting, and the Z-axis caption is used to write the caption above it. Lines are drawn across the bar at the z-tickmark intervals, and the lines are drawn with the current contour style.