| Professional charting tools for .Net developers |
Introducing SharpPlot
Your First Chart
Recent Updates
Tutorials
General Tutorials
Chart Tutorials
Reference
SharpPlot Class
Properties
Methods
Structures
Enumerations
Style examples
Glossaries
Active Charts
VectorMath Class
DBUtil Class
Get SharpPlot
Download SharpPlot
Buying SharpPlot
SharpPlot Support
Upgrading from GraPL
Release notes
Home > Sample Charts > CloudChart
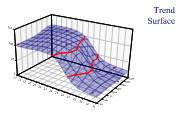
CloudChart
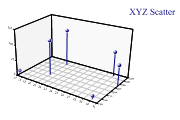
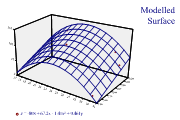
The Cloud chart is essentially a scatter-plot in 3 dimensions (maybe you are running an experiment in which you vary pressure and temperature, and are interested in the yield of the result). Rather than fitting a line to show the relationship between input and output, you fit a plane (if the data is linear in both x and y) or a curved surface. The markers are often located in XY-space by drawing risers from the ‘paper’ – this makes it much easier to visualise where they are positioned.
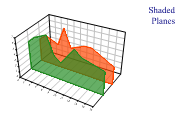
In fact, the Cloudchart is much more versatile than this, as it can also be drawn with lines connecting the points, or planes shaded down to the XY plane (the Z-value is always assumed to be drawn vertically). Multiple charts may be combined using a common set of axes to make quite complex diagrams in 3 dimensions.
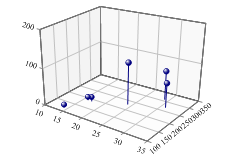
SharpPlot sp = new SharpPlot;
sp.SetMargins(0,12,18,4);
sp.SetMarkers(Marker.Bullet);
ydata = new int[] {190,270,310,120,190,230};
xdata = new int[] {17,31,29,14,16,24};
zdata = new int[] {12,65,77,7,9,112};
sp.CloudChartStyle = CloudChartStyles.WallShading|CloudChartStyles.GridLines|
         CloudChartStyles.Risers;
sp.SetMarkers(Marker.Ball);
sp.SetXTickMarks(5);
sp.SetYTickMarks(50);
sp.SetZTickMarks(100);
sp.Perspective = 6;
sp.SetAxisStyle(Color.Gray,LineStyle.Solid,0.5);
sp.DrawCloudChart(xdata,ydata,zdata);
Worked Examples
 |
 |
 |
 |