| Professional charting tools for .Net developers |
Introducing SharpPlot
Your First Chart
Recent Updates
Sample Charts
Tutorials
General Tutorials
Chart Tutorials
SharpPlot Class
Properties
Methods
Structures
Enumerations
Glossaries
Active Charts
VectorMath Class
DBUtil Class
Get SharpPlot
Download SharpPlot
Buying SharpPlot
SharpPlot Support
Upgrading from GraPL
Release notes
Reference > Style examples > Walls are shaded on 3D charts
Walls are shaded on 3D charts
The XZ, YZ and XY planes of 3D charts are shaded to form walls and a floor.
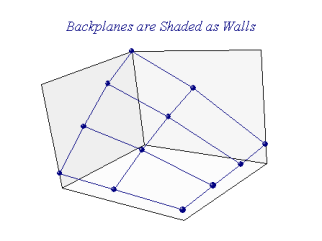
sp.TowerChartStyle = TowerChartStyles.WallShading;
This usually improves the readability of 3D charts as it gives a better sense of perspective.
See also ...
SharpPlot | CloudChartStyle | ResponsePlotStyle | TowerChartStyle | SetTowerFillStyles