| Professional charting tools for .Net developers |
Introducing SharpPlot
Your First Chart
Recent Updates
Sample Charts
Tutorials
General Tutorials
Chart Tutorials
SharpPlot Class
Properties
Methods
Structures
Enumerations
Glossaries
Active Charts
VectorMath Class
DBUtil Class
Get SharpPlot
Download SharpPlot
Buying SharpPlot
SharpPlot Support
Upgrading from GraPL
Release notes
Reference > Style examples > Risers from axis or data
Risers from axis or data
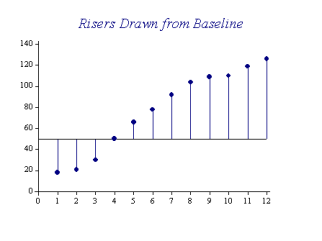
Risers are drawn from the X-axis (or XY-plane in 3D charts) to each datapoint. If a baseline is defined, this is used as the target for the risers, rather than the axis.

sp.LineGraphStyle = LineGraphStyles.Risers;
For polar charts the risers are drawn as radial lines from the centre.
Using risers to show residuals
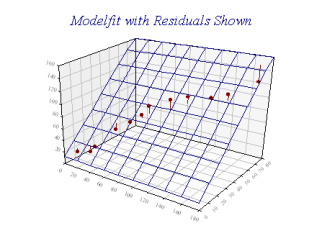
When a modelfit or trend surface has been used in a Scatter plot or Cloud chart (3D scatter) the risers are drawn from the regression line or fitted surface to each datapoint, rather than from the X-axis or XY-plane.

This provides a quick visual check of the residuals, and may help to locate the datapoints relative to the fitted surface in the projection of the 3D chart.
See also ...
SharpPlot | CloudChartStyle | HistogramStyle | LineGraphStyle | PolarChartStyle | ResponsePlotStyle | ScatterPlotStyle | StepChartStyle