| Professional charting tools for .Net developers |
Introducing SharpPlot
Your First Chart
Recent Updates
Tutorials
General Tutorials
Chart Tutorials
Reference
SharpPlot Class
Properties
Methods
Structures
Enumerations
Style examples
Glossaries
Active Charts
VectorMath Class
DBUtil Class
Get SharpPlot
Download SharpPlot
Buying SharpPlot
SharpPlot Support
Upgrading from GraPL
Release notes
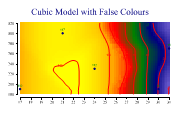
Home > Sample Charts > ContourPlot
ContourPlot
Contour plots are often an excellent alternative to 3D presentations where the object is to model three-dimensional data. Obviously, they can be used ‘just like a map’ where you may have a set of spot-heights (z-values) at various locations on the xy-plane. In this case, there is no particular shape assumed for the landscape, and the contours would simply be drawn to give the best ‘smooth interpretation’ of the recorded heights.
Another good use of contour plots is to fit some kind of model to the results from any experiment where two factors are systematically altered, and a third one is measured. In this case, the contours represent the model (they will simply be angled lines if the model is linear in both x and y directions) and make it very easy to read off the predicted result for any combination of input variables.
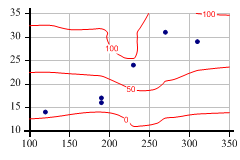
SharpPlot sp = new SharpPlot;
sp.SetMargins(6,18,18,4);
sp.SetMarkers(Marker.Bullet);
sp.ContourPlotStyle = ContourPlotStyles.GridLines|ContourPlotStyles.Curves;
sp.SetXTickMarks(50);
sp.SetZTickMarks(50);
sp.MeshDensity = 5;
ydata = new int[] {190,270,310,120,190,230};
xdata = new int[] {17,31,29,14,16,24};
elevation = new int[] {12,65,77,7,9,112};
sp.DrawContourPlot(ydata,xdata,elevation);
Worked Examples
 |
 |
 |
 |