| Professional charting tools for .Net developers |
Introducing SharpPlot
Your First Chart
Recent Updates
Tutorials
General Tutorials
Chart Tutorials
Reference
SharpPlot Class
Properties
Methods
Structures
Enumerations
Style examples
Glossaries
Active Charts
VectorMath Class
DBUtil Class
Get SharpPlot
Download SharpPlot
Buying SharpPlot
SharpPlot Support
Upgrading from GraPL
Release notes
Home > Sample Charts > ContourPlot > Fitting a Flexible Cubic Model
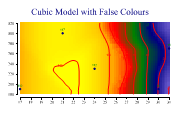
Fitting a Flexible Cubic Model
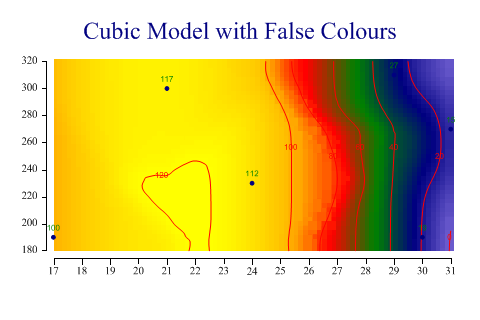
Contour plots are often an excellent alternative to 3D presentations where the object is to model three-dimensional data. Obviously, they can be used ‘just like a map’ where you may have a set of spot-heights (z-values) at various locations on the xy-plane.
The final example generates the most ‘satisfying’ map, from a purely visual point of view. This allows SharpPlot to fit a cubic regression surface in the x-direction, then apply a little flexibility to this to finalise the shape of the surface. No underlying model is assumed in the y-direction.
This combination of modelfit and flexibility is a good approach when you know that the z-value is composed of several effects, some of which are expected to obey a known model, but some of which are effectively ‘random’ values.
SharpPlot sp = new SharpPlot;

zdata = new int[] {100,15,27,117,19,112};
xdata = new int[] {17,31,29,21,30,24};
ydata = new int[] {190,270,310,300,190,230};

sp.Heading = "Cubic Model with False Colours";
sp.SetAltitudeColors(new Color[]{Color.SlateBlue,Color.Navy,Color.Green,Color.Red,
         Color.Orange,Color.Yellow});

sp.ContourPlotStyle = (ContourPlotStyles.ValueTags|ContourPlotStyles.ExplodeAxes|
         ContourPlotStyles.AltitudeShading|ContourPlotStyles.Curves);
sp.SetMarkers(Marker.Bullet);

sp.SetOrderOfFit(3,0);
sp.Flexibility = 8;
sp.MeshDensity = 3;

sp.DrawContourPlot(xdata,ydata,zdata);
Worked Examples
 |
 |
 |
 |