| Professional charting tools for .Net developers |
Introducing SharpPlot
Your First Chart
Recent Updates
Tutorials
General Tutorials
Chart Tutorials
Reference
SharpPlot Class
Properties
Methods
Structures
Enumerations
Style examples
Glossaries
Active Charts
VectorMath Class
DBUtil Class
Get SharpPlot
Download SharpPlot
Buying SharpPlot
SharpPlot Support
Upgrading from GraPL
Release notes
Home > Sample Charts > ContourPlot > Fitting an Accurate set of Spot-heights
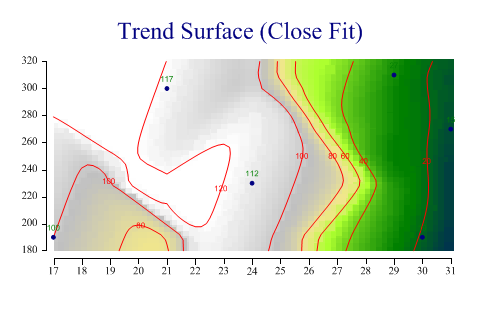
Fitting an Accurate set of Spot-heights
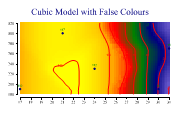
Contour plots are often an excellent alternative to 3D presentations where the object is to model three-dimensional data. Obviously, they can be used ‘just like a map’ where you may have a set of spot-heights (z-values) at various locations on the xy-plane. If the z-values really represent accurately measured values (spot heights in a landscape) then the map should be forced to fit itself around them.
This example increases the mesh-density (to compute the contours at many more points) and sets the flexibility high enough to force the contours to behave correctly with respect to the points nearby. Whether this map is better than any other is (of course) arguable. It is an interesting exercise to take a set of points like this and attempt to make the map by hand.
SharpPlot sp = new SharpPlot;

zdata = new int[] {100,15,27,117,19,112};
xdata = new int[] {17,31,29,21,30,24};
ydata = new int[] {190,270,310,300,190,230};

sp.Heading = "Trend Surface (Close Fit)";
sp.SetAltitudeColors(new Color[]{Color.Navy,Color.Green,Color.GreenYellow,
         Color.Khaki,Color.Silver,Color.White});
sp.ContourPlotStyle = ContourPlotStyles.ValueTags|ContourPlotStyles.ExplodeAxes|
         ContourPlotStyles.AltitudeShading;
sp.SetMarkers(Marker.Bullet);

sp.Flexibility = 8;
sp.MeshDensity = 5;

sp.DrawContourPlot(xdata,ydata,zdata);
Worked Examples
 |
 |
 |
 |