| Professional charting tools for .Net developers |
Introducing SharpPlot
Your First Chart
Recent Updates
Tutorials
General Tutorials
Chart Tutorials
Reference
SharpPlot Class
Properties
Methods
Structures
Enumerations
Style examples
Glossaries
Active Charts
VectorMath Class
DBUtil Class
Get SharpPlot
Download SharpPlot
Buying SharpPlot
SharpPlot Support
Upgrading from GraPL
Release notes
Home > Sample Charts > ContourPlot > A Simple 2-variable Regression Surface
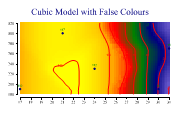
A Simple 2-variable Regression Surface
Contour plots are often an excellent alternative to 3D presentations where the object is to model three-dimensional data. Obviously, they can be used ‘just like a map’ where you may have a set of spot-heights (z-values) at various locations on the xy-plane.
This example fits the same Quadratic surface as the third CloudChart tutorial. You can see that several of the points fall on the ‘wrong’ side of the line, which is very reasonable for a noisy dataset where the Z-values may be subject to a large random error.
The Cloudchart is probably a better tool for an initial visualisation, but the Contourplot is much more suitable if you want to answer questions like “what is the best estimate for z, given x and y” as you can easily read off the required numbers.
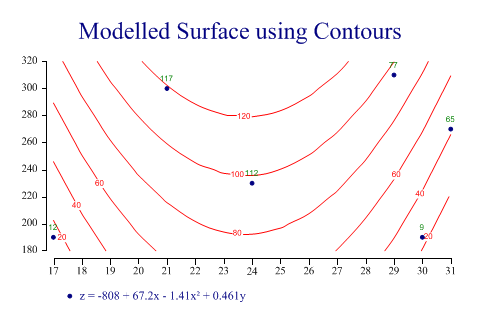
SharpPlot sp = new SharpPlot;
sp.Heading = "Modelled Surface using Contours";

zdata = new int[] {12,65,77,117,9,112};
xdata = new int[] {17,31,29,21,30,24};
ydata = new int[] {190,270,310,300,190,230};

sp.SetOrderOfFit(2,1);
sp.Flexibility = 0;
sp.EquationFormat = "z = C0 + C1x + C2x² + C3y";

sp.ContourPlotStyle = ContourPlotStyles.ValueTags|ContourPlotStyles.ExplodeAxes|
         ContourPlotStyles.Curves;
sp.SetMarkers(Marker.Bullet);

sp.DrawContourPlot(xdata,ydata,zdata);
sp.SetKeyText(sp.Equation);
Worked Examples
 |
 |
 |
 |