| Professional charting tools for .Net developers |
Introducing SharpPlot
Your First Chart
Recent Updates
Sample Charts
Tutorials
General Tutorials
Chart Tutorials
SharpPlot Class
Properties
Methods
Structures
Enumerations
Glossaries
Active Charts
VectorMath Class
DBUtil Class
Get SharpPlot
Download SharpPlot
Buying SharpPlot
SharpPlot Support
Upgrading from GraPL
Release notes
Reference > Style examples > Value tags are added to all data points
Value tags are added to all data points
Data values are written next to each marker, or on top (or inside) each bar.
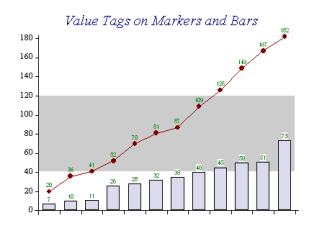
sp.LineGraphStyle = LineGraphStyles.ValueTags;
The detailed placement may be adjusted with the Value style setting which also allows the tags to be drawn opaque (as shown on the bars) or transparent.
See also ...
SharpPlot | BarChartStyle | GanttChartStyle | HistogramStyle | LineGraphStyle | MinMaxChartStyle | PieChartStyle | ScatterPlotStyle | StepChartStyle | VennDiagramStyle | XBarChartStyle | SetValueTags