| Professional charting tools for .Net developers |
Introducing SharpPlot
Your First Chart
Recent Updates
Tutorials
General Tutorials
Chart Tutorials
Reference
SharpPlot Class
Properties
Methods
Structures
Enumerations
Style examples
Glossaries
Active Charts
VectorMath Class
DBUtil Class
Get SharpPlot
Download SharpPlot
Buying SharpPlot
SharpPlot Support
Upgrading from GraPL
Release notes
Home > Sample Charts > ContourPlot > An Approximate Trend Surface
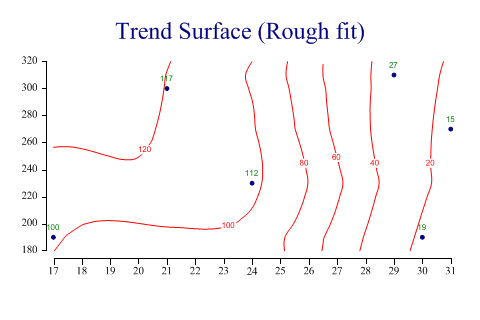
An Approximate Trend Surface
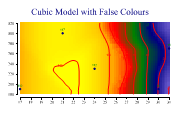
Contour plots are often an excellent alternative to 3D presentations where the object is to model three-dimensional data. Obviously, they can be used ‘just like a map’ where you may have a set of spot-heights (z-values) at various locations on the xy-plane.
The remaining examples all use the same set of data-points as the final example in the Cloudchart tutorial. The same data-set can produce very different ‘landscapes’ depending on the model chosen.
The first surface shows the effect of setting the flexibility quite low. Each computed point on the xy grid then ‘sees’ many of the nearby points and the effect is create a quite smooth (but strongly averaged) surface. This would be a suitable model if the data were known to be noisy, and a rough feel for the shape of the surface was all that was required.
SharpPlot sp = new SharpPlot;

zdata = new int[] {100,15,27,117,19,112};
xdata = new int[] {17,31,29,21,30,24};
ydata = new int[] {190,270,310,300,190,230};

sp.Heading = "Trend Surface (Rough fit)";

sp.ContourPlotStyle = ContourPlotStyles.ValueTags|ContourPlotStyles.ExplodeAxes|
         ContourPlotStyles.Curves;
sp.SetMarkers(Marker.Bullet);

sp.Flexibility = 5;
sp.MeshDensity = 2;

sp.DrawContourPlot(xdata,ydata,zdata);
Worked Examples
 |
 |
 |
 |