| Professional charting tools for .Net developers |
Introducing SharpPlot
Your First Chart
Recent Updates
Sample Charts
Tutorials
General Tutorials
Chart Tutorials
SharpPlot Class
Properties
Methods
Structures
Enumerations
Glossaries
Active Charts
VectorMath Class
DBUtil Class
Get SharpPlot
Download SharpPlot
Buying SharpPlot
SharpPlot Support
Upgrading from GraPL
Release notes
Reference > Style examples > Altitude shading
Altitude shading
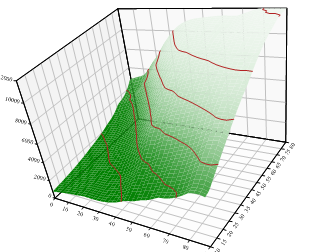
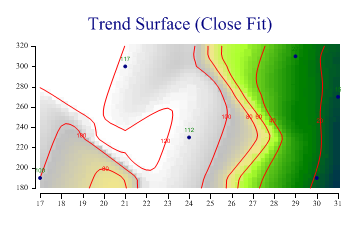
Applies graded colour to tiled response surfaces or contour plots.

sp.ResponsePlotStyle = ResponsePlotStyles.AltitudeShading;
This is best used with a computed (and therefore smooth) surface and can work well as a way to show experimental results where the outcome is a function of several variables.
Shading used with Contour plots

This example shows a fitted surface which is typical of height-map data. Temperature or pressure data would also be a good candidate for this style, using one of the accepted styles of false-color banding.
See also ...
SharpPlot Members | CloudChartStyle Property | ContourPlotStyle Property | ResponsePlotStyle Property