| Professional charting tools for .Net developers |
Introducing SharpPlot
Your First Chart
Recent Updates
Sample Charts
Tutorials
General Tutorials
Chart Tutorials
SharpPlot Class
Properties
Methods
Structures
Enumerations
Glossaries
Active Charts
VectorMath Class
DBUtil Class
Get SharpPlot
Download SharpPlot
Buying SharpPlot
SharpPlot Support
Upgrading from GraPL
Release notes
Reference > Style examples > Trend surface
Trend surface
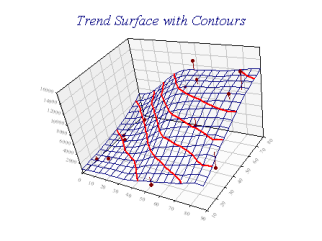
You can use the gaussian fitting process with 3D data to put a trend surface through a set of spot-height values.

This can be a useful way to visualise a landscape given a series of discrete altitude values. Contours are drawn at the Z-tickmarks if style ‘contour’ is set, and if style ‘riser’ is selected, the risers are drawn from the surface rather than from the XY-plane.