| Professional charting tools for .Net developers |
Introducing SharpPlot
Your First Chart
Recent Updates
Tutorials
General Tutorials
Chart Tutorials
Reference
SharpPlot Class
Properties
Methods
Structures
Enumerations
Style examples
Glossaries
Active Charts
VectorMath Class
DBUtil Class
Get SharpPlot
Download SharpPlot
Buying SharpPlot
SharpPlot Support
Upgrading from GraPL
Release notes
Home > Sample Charts > ScatterPlot > Adding Another Dimension
Adding Another Dimension
The Scatter plot is most often used to answer questions like “How does Age affect Reaction time?” where you have a variety of measurements and are trying to get an impression of the relationships between them. Of course a relationship does not always imply causality, but with care it is usually possible to make a predictive model which gives useful information.
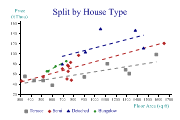
Maybe the type of house is an important factor here?
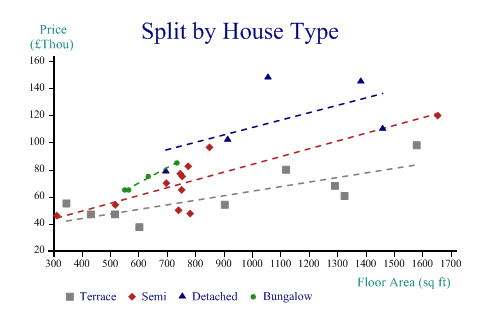
Suddenly, this makes the prediction a lot more reliable. We can see that for terrace houses (the grey squares) the relationship between area and price is quite linear and has very little scatter. Semi-detached houses all cluster at the left-hand end, apart from one huge one which we may want to disregard, as being very atypical. Detached houses follow a different model entirely, and bungalows are apparently more sensitive to area, but we have very little data for them.
Note the ‘placeholder’ entries in the key text here. SharpPlot adds a key placeholder for each series and for each modelfit (or trendline) added to it. This allows you to add specific legends to describe the model as well as to annotate each marker. However in this case the model is ‘obvious’ and we have specified empty strings for the alternate entries in the legend.
This is also the reason why the color cycle is preset with pair of matching colors – the marker takes the first of the pair and the line takes the second.
SharpPlot sp = new SharpPlot;
sp.Heading = "Split by House Type";
sp.YAxisStyle = YAxisStyles.AtEndCaption;
sp.YCaption = "Price\n(£Thou)";
sp.YFactor = 1000;
sp.XCaption = "Floor Area (sq ft)";

housetype = new int[] {1,2,2,3,3,2,1,1,2,4,4,1,2,2,3,2,1,1,2,3,1,1,4,3,1,2,2,2,4};
sp.SplitBy(housetype);

sp.ScatterPlotStyle = ScatterPlotStyles.ModelFit;
sp.EquationStyle = EquationStyles.SpanData;
sp.SetMarkers(new Marker[]{Marker.Block,Marker.Lozenge,Marker.Triangle,Marker.Bullet});
sp.SetColors(new Color[]{Color.Gray,Color.Gray,Color.Firebrick,Color.Firebrick,
         Color.Navy,Color.Navy,Color.ForestGreen,Color.ForestGreen});
sp.SetLineStyles(LineStyle.Dash);
sp.SetPenWidths(1.2);

sp.DrawScatterPlot(price,area);

sp.SetKeyText(new string[]{"Terrace","","Semi","","Detached","","Bungalow"});
Worked Examples
 |
 |
 |
 |