| Professional charting tools for .Net developers |
Introducing SharpPlot
Your First Chart
Recent Updates
Sample Charts
Tutorials
General Tutorials
Chart Tutorials
SharpPlot Class
Properties
Methods
Structures
Enumerations
Glossaries
Active Charts
VectorMath Class
DBUtil Class
Get SharpPlot
Download SharpPlot
Buying SharpPlot
SharpPlot Support
Upgrading from GraPL
Release notes
Reference > Style examples > Trendline spans data range
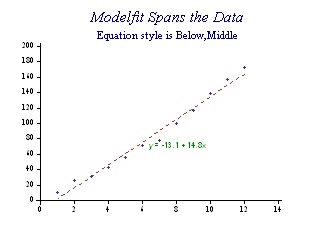
Trendline spans data range
The fitted line is not extended beyond the extreme points on the x-axis

// Set equation under the chart and span the reqression line
 sp.EquationStyle = EquationStyles.Middle|EquationStyles.Below|EquationStyles.SpanData;
 sp.EquationFormat = "y = C0 + C1x";
This may be a useful setting if several regressions are made through subsets of the data.