| Professional charting tools for .Net developers |
Introducing SharpPlot
Your First Chart
Recent Updates
Sample Charts
Tutorials
General Tutorials
Chart Tutorials
SharpPlot Class
Properties
Methods
Structures
Enumerations
Glossaries
Active Charts
VectorMath Class
DBUtil Class
Get SharpPlot
Download SharpPlot
Buying SharpPlot
SharpPlot Support
Upgrading from GraPL
Release notes
Reference > Style examples > Modelfit
Modelfit
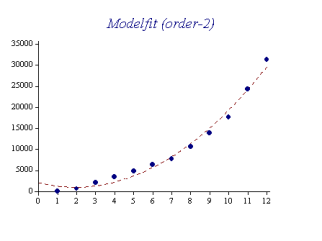
A simple regression model is fitted to the data.

sp.LineGraphStyle = LineGraphStyles.ModelFit;
The default is a linear ‘straight-line’ fit but you can use the Order of Fit setting to fit models up to quartics. The line may be annotated with the regression coefficients. The ‘zeroth’ coefficient is the intercept value, and there will be as many further coefficients as the order of fit.
Fitting 3D data
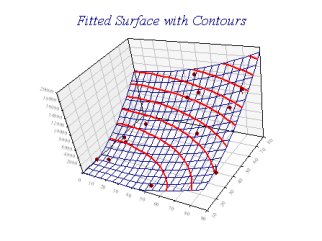
If the modelfit style is used with the cloud chart, the fit is made against both X and Y axes, and the order of fit may be set independently for either.

Here, the model is quadratic in both X and Y. Contour lines are shown, and risers have been used to show the residual values in the Z-direction.
See also ...
SharpPlot | CloudChartStyle | LineGraphStyle | ScatterPlotStyle | SetModelSpan