| Professional charting tools for .Net developers |
Introducing SharpPlot
Your First Chart
Recent Updates
Tutorials
General Tutorials
Chart Tutorials
Reference
SharpPlot Class
Properties
Methods
Structures
Enumerations
Style examples
Glossaries
Active Charts
VectorMath Class
DBUtil Class
Get SharpPlot
Download SharpPlot
Buying SharpPlot
SharpPlot Support
Upgrading from GraPL
Release notes
Home > Sample Charts > BarChart > Horizontal barchart, with ticks and gridlines between bars
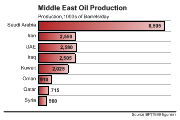
Horizontal barchart, with ticks and gridlines between bars
This chart of oil reserves is again designed for easy reading, and uses the horizontal style to allow space for the labels. The gradient fill is usd to good effect here to add contrast to the data values. These are shown inside the bars, unless there was insufficient space, when SharpPlot automatically moves the text to the right-hand end of the bar.
For high-contrast labels, you might also use white text with the value style ‘invert’ to have the text drawn in the base color of the bar, if it was moved outside.
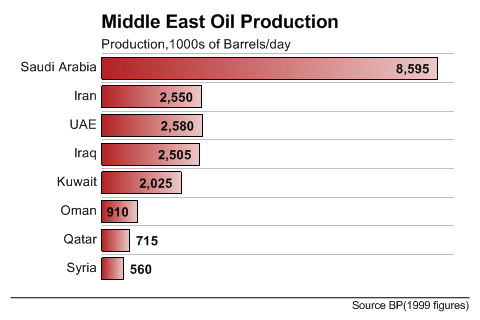
SharpPlot sp = new SharpPlot;

sp.SetBackground(Color.White,FillStyle.Solid);

country = new string[]{"Syria","Qatar","Oman","Kuwait","Iraq","UAE","Iran","Saudi Arabia"};
barrels = new int[] {560,715,910,2025,2505,2580,2550,8595};

sp.SetMargins(36,24,72,16);
sp.SetColors(Color.Firebrick);
sp.SetFillStyles(FillStyle.GradientLeft);

sp.BarChartStyle = BarChartStyles.Horizontal|BarChartStyles.ValueTags|
         BarChartStyles.TicksBetween;
sp.XAxisStyle = XAxisStyles.ForceZero|XAxisStyles.NoAxis;
sp.YAxisStyle = YAxisStyles.GridLines|YAxisStyles.MiddleLabels|YAxisStyles.InvisibleAxis;
sp.YTickStyle = YTickStyles.NoTicks;

sp.Gap = 0.3;

sp.SetLabelFont("Arial",10,Color.Black);

sp.SetValueFont("Arial",10,FontStyle.Bold,Color.Black);
sp.ValueTagFormat = "#,##0";
sp.ValueTagStyle = ValueTagStyles.Inside;

sp.Heading = "Middle East Oil Production";
sp.SetHeadingFont("ARB",14,Color.Black);
sp.HeadingStyle = HeadingStyles.Left;

sp.Subheading = "Production,1000s of Barrels/day";
sp.SetSubheadingFont("Arial",10,Color.Black);

sp.Footnote = "Source BP(1999 figures)";
sp.FootnoteStyle = FootnoteStyles.Right|FootnoteStyles.RuledAbove;
sp.SetFootnoteFont("Arial",8,Color.Black);

sp.SetYLabels(country);
sp.DrawBarChart(barrels);
Worked Examples
 |
 |
 |
 |