| Professional charting tools for .Net developers |
Introducing SharpPlot
Your First Chart
Recent Updates
Sample Charts
Tutorials
General Tutorials
Chart Tutorials
SharpPlot Class
Properties
Methods
Structures
Enumerations
Glossaries
Active Charts
VectorMath Class
DBUtil Class
Get SharpPlot
Download SharpPlot
Buying SharpPlot
SharpPlot Support
Upgrading from GraPL
Release notes
Reference > Style examples > Horizontal
Horizontal
Barcharts, Boxplots, Stepcharts and Min-max charts may be drawn horizontally.
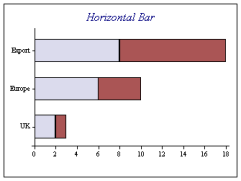
sp.BarChartStyle = BarChartStyles.Horizontal;
This does NOT change the meaning of the X and Y axes, so to label the bars, you must use Y-labels here. The same applies to other chart types which support this style, for example a population pyramid may be contructed with a horizontal stepchart:
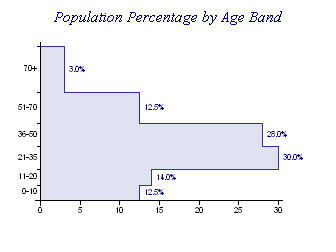
sp.StepChartStyle = StepChartStyles.Horizontal|StepChartStyles.ValueTags|StepChartStyles.SurfaceShading;
sp.ValueTagFormat = "##9.9%";
sp.YAxisStyle = YAxisStyles.MiddleLabels;
Value tags are always drawn horizontally with this chart style.
See also ...
SharpPlot | BarChartStyle | BoxPlotStyle | MinMaxChartStyle | XBarChartStyle