| Professional charting tools for .Net developers |
Introducing SharpPlot
Your First Chart
Recent Updates
Tutorials
General Tutorials
Chart Tutorials
Reference
SharpPlot Class
Properties
Methods
Structures
Enumerations
Style examples
Glossaries
Active Charts
VectorMath Class
DBUtil Class
Get SharpPlot
Download SharpPlot
Buying SharpPlot
SharpPlot Support
Upgrading from GraPL
Release notes
Home > Sample Charts > BarChart > Stacked data, drawn horizontally
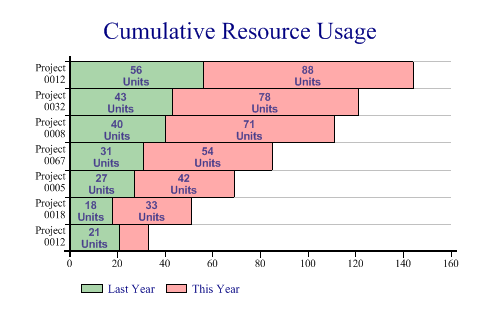
Stacked data, drawn horizontally
This is a very typical format for a horizontal barchart. In this example, the labels show the values of each sector (SharpPlot defaults to showing the cumulative totals) and are centered in the bars.
Note that the labels are automatically formatted, and will be elided if there is insufficient space in the bar to show them
SharpPlot sp = new SharpPlot;

data = new int[][]{new int[]{21,18,27,31,40,43,56},new int[]{12,33,42,54,71,78,88}};

sp.Heading = "Cumulative Resource Usage";
sp.BarChartStyle = BarChartStyles.TicksBetween|BarChartStyles.ValueTags|
         BarChartStyles.ForceZero|BarChartStyles.Horizontal|
         BarChartStyles.StackedBars;
sp.YAxisStyle = YAxisStyles.MiddleLabels|YAxisStyles.GridLines|YAxisStyles.CenteredCaption;
sp.ValueTagStyle = ValueTagStyles.Middle|ValueTagStyles.SectorValues;
sp.SetValueFont("Arial",8,FontStyle.Bold,Color.DarkSlateBlue);
sp.ValueTagFormat = "###0\nUnits";

sp.Gap = 0;
sp.MarginLeft = 48;

sp.SetColors(new Color[]{Color.Green,Color.Red});
sp.SetFillStyles(FillStyle.Halftone);

sp.YLabelFormat = "Project\n#0000";  // Allows newlines here
sp.SetYLabels(new int[] {12,18,5,67,8,32});
sp.SetKeyText(new string[]{"Last Year","This Year"});

sp.DrawBarChart(data);
Worked Examples
 |
 |
 |
 |