| Professional charting tools for .Net developers |
Introducing SharpPlot
Your First Chart
Recent Updates
Tutorials
General Tutorials
Chart Tutorials
Reference
SharpPlot Class
Properties
Methods
Structures
Enumerations
Style examples
Glossaries
Active Charts
VectorMath Class
DBUtil Class
Get SharpPlot
Download SharpPlot
Buying SharpPlot
SharpPlot Support
Upgrading from GraPL
Release notes
Home > Sample Charts > PolarChart > Circular Linegraph of Daily Temperatures
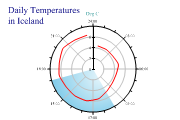
Circular Linegraph of Daily Temperatures
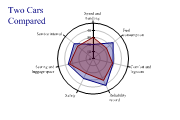
The Polar chart (also known as the Radar chart) may be used in several ways to handle cyclic timeseries or comparisons on many dimensions. This chart copies the typical pen-recorder often seen in computer rooms to track temperature and humidity.
The data values become radii, and time is plotted around the circle as a 24-hour clock – the x-tickmarks are given in hours here. X-zones may be used to indicate times of day.
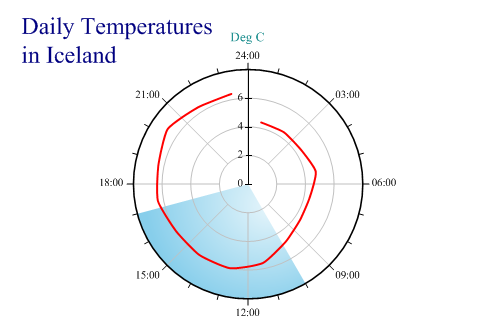
SharpPlot sp = new SharpPlot;

sp.Heading = "Daily Temperatures\nin Iceland";
sp.HeadingStyle = HeadingStyles.Left;
sp.SetMargins(48,12,12,0);

times = new double[] {0.8,2.3,3.8,5.3,6.8,8.3,9.8,11.3,12.8,14.3,15.8,17.3,18.8,
         20.3,21.8,23.3};
temps = new double[] {4.4,4.4,4.4,4.8,4.4,4.4,4.8,5.6,6,6,6,6.4,6.4,6.8,6.4,6.4};

sp.SetYRange(0,8);
sp.SetYTickMarks(2);
sp.SetXTickMarks(3,2);

sp.YLabelFormat = "#0°";

sp.YCaption = "Deg C";
sp.SetColors(Color.Red);
sp.SetPenWidths(1.5);

sp.SetXZones(new Zone(10,17,Color.SkyBlue,FillStyle.Dome));

sp.PolarChartStyle = PolarChartStyles.ClockFace|PolarChartStyles.GridLines|
         PolarChartStyles.Curves|PolarChartStyles.HollowCenter;
sp.DrawPolarChart(temps,times);
Worked Examples
 |
 |
 |
 |