| Professional charting tools for .Net developers |
Introducing SharpPlot
Your First Chart
Recent Updates
Tutorials
General Tutorials
Chart Tutorials
Reference
SharpPlot Class
Properties
Methods
Structures
Enumerations
Style examples
Glossaries
Active Charts
VectorMath Class
DBUtil Class
Get SharpPlot
Download SharpPlot
Buying SharpPlot
SharpPlot Support
Upgrading from GraPL
Release notes
Home > Sample Charts > PolarChart > ScatterPlot of the Night Sky
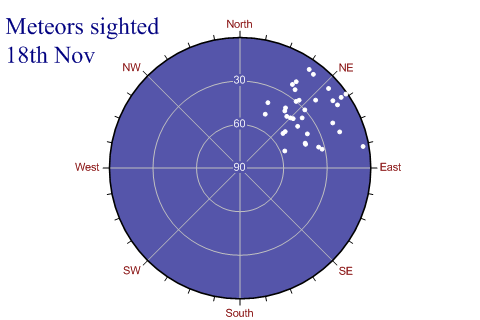
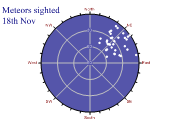
ScatterPlot of the Night Sky
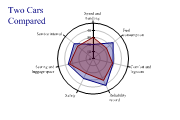
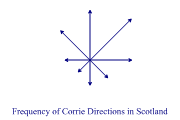
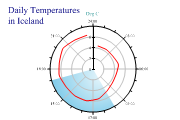
The Polar chart (also known as the Radar chart) may be used in several ways to handle cyclic timeseries or comparisons on many dimensions. If it is called with a simple list of numbers, it treats each value as a logical axis and simply plots the values out as a star shape with as many points as there were values.
This example is genuinely Polar data, so it is best plotted around a circle. The y-values are altitude (but of course 90 is at the Zenith) and the x-values give the direction of the observation.
This chart could also be used with daily data, for example a count of web-site hits over 24 hours.
SharpPlot sp = new SharpPlot;

altitude = new int[] {8,42,1,38,20,35,34,28,22,50,52,40,30,10,7,41,41,17,11,30,5,8,
         42,42,19,24,57,38,32,4,19,40,41,49};
azimuth = new int[] {48,42,55,63,48,51,75,41,32,51,51,38,48,57,35,54,23,70,54,40,55,
         38,69,70,64,35,69,37,77,80,33,47,45,25};

sp.PolarChartStyle = PolarChartStyles.Markers|PolarChartStyles.GridLines|
         PolarChartStyles.CompassPlot|PolarChartStyles.NoLines;
sp.YAxisStyle = YAxisStyles.ForceZero;
sp.Heading = "Meteors sighted\n18th Nov";
sp.HeadingStyle = HeadingStyles.Left;

sp.SetMargins(24,12,0,0);

sp.SetXLabels(new string[]{"NE","East","SE","South","SW","West","NW","North"});
sp.SetXTickMarks(45,3);
sp.SetYTickMarks(new int[] {0,30,60,90});
sp.SetXLabelFont("arial",8,FontStyle.Regular,Color.Maroon);
sp.SetYLabelFont("arial",8,FontStyle.Regular,Color.White);
sp.YAxisStyle = YAxisStyles.InvertAxis|YAxisStyles.InvisibleAxis;
sp.SetChartBackground(Color.Navy,FillStyle.Saturate80);
sp.LabelStyle = LabelStyles.Opaque;  // Background for circle - also May 03
sp.SetMarkers(Marker.Bullet);
sp.SetColors(Color.White);

sp.DrawPolarChart(altitude,azimuth);
Worked Examples
 |
 |
 |
 |