| Professional charting tools for .Net developers |
Introducing SharpPlot
Your First Chart
Recent Updates
Tutorials
General Tutorials
Chart Tutorials
Reference
SharpPlot Class
Properties
Methods
Structures
Enumerations
Style examples
Glossaries
Active Charts
VectorMath Class
DBUtil Class
Get SharpPlot
Download SharpPlot
Buying SharpPlot
SharpPlot Support
Upgrading from GraPL
Release notes
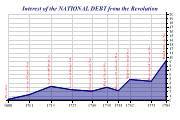
Home > Sample Charts > LineGraph > The Playfair Plot
The Playfair Plot
Linegraphs are most commonly used to represent data which changes over time (stock prices or currency values are typical) but may be used wherever pairs of X and Y values are joined by lines.
This chart (quoted in Tufte’s first book) was first used in 1760 to show the rising national debt in England. There are quite a lot of properties to set here, but it is tedious rather than hard, to get the feel of the original graphic.
The most interesting design feature is the x-tick spacing where significant historical dates have been used to mark the years. The Y-axis is intentionally over-scaled to reduce the political impact of the graphic! Playfair’s first draft of this chart was much more dramatic. Opacity is used to give the effect of a water-color wash as used in the original drawing.
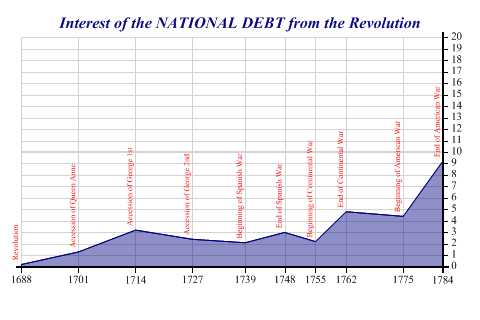
SharpPlot sp = new SharpPlot;

years = new int[] {1688,1701,1714,1727,1739,1748,1755,1762,1775,1784};
debt = new double[] {0.2,1.3,3.2,2.4,2.1,3,2.2,4.8,4.4,9.2};

sp.LineGraphStyle = LineGraphStyles.SurfaceShading|LineGraphStyles.ValueTags;
sp.SetMargins(24,36,12,24);
sp.XAxisStyle = XAxisStyles.GridLines;
sp.YAxisStyle = YAxisStyles.GridLines|YAxisStyles.RightAxis;
sp.SetHeadingFont("times",12,(FontStyle.Bold|FontStyle.Italic));
sp.SetGridLineStyle(Color.LightGray,LineStyle.Solid,0.3);
sp.SetDatumLineStyle(Color.LightGray,LineStyle.Solid,1.5);
sp.SetXTickMarks(years);
sp.SetYRange(20);
sp.SetYTickMarks(1);
sp.SetFillStyles(FillStyle.Opacity42);
sp.Heading = "Interest of the NATIONAL DEBT from the Revolution";
sp.SetYDatumLines(10);

vtags = new string[]{"Revolution","Accession of Queen Anne",
         "Accession of George 1st","Accession of George 2nd",
         "Beginning of Spanish War","End of Spanish War",
         "Beginning of Continental War","End of Continental War",
         "Beginning of American War","End of American War"};

sp.SetValueTags(vtags);
sp.SetValueFont("Times",6,FontStyle.Regular,Color.Red);
sp.ValueTagStyle = ValueTagStyles.Vertical;

sp.DrawLineGraph(debt,years);
Worked Examples
 |
 |
 |
 |