| Professional charting tools for .Net developers |
Introducing SharpPlot
Your First Chart
Recent Updates
Tutorials
General Tutorials
Chart Tutorials
Reference
SharpPlot Class
Properties
Methods
Structures
Enumerations
Style examples
Glossaries
Active Charts
VectorMath Class
DBUtil Class
Get SharpPlot
Download SharpPlot
Buying SharpPlot
SharpPlot Support
Upgrading from GraPL
Release notes
Home > Sample Charts > LineGraph > Drawing a Line given both x and y values
Drawing a Line given both x and y values
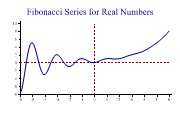
Linegraphs are most commonly used to represent data which changes over time (stock prices or currency values are typical) but may be used wherever pairs of X and Y values are joined by lines. The default is to join the points with straight lines, but for some applications (for example illustrating a graph of Y-squared versus X) then it is better to use smooth curves.
This example illustrates a mathematical curve, with computed x and y values. The ‘curves’ style works well for examples like this, as many fewer intermediate points are required to give a pleasing result.
It is called a Fibonacci spiral, and cuts the x-axis at the classic Fibonacci series values of 1 1 2 3 5 8 and so on.
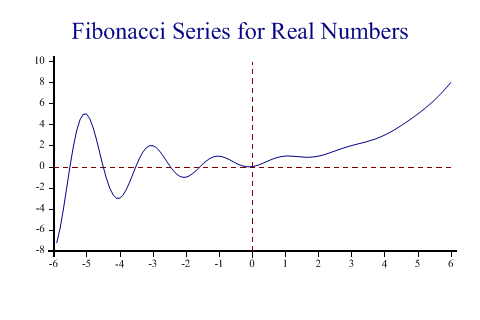
SharpPlot sp = new SharpPlot;

sp.Heading = "Fibonacci Series for Real Numbers";

ydata = FibFn(xdata);

sp.SetXDatumLines(0);
sp.SetYDatumLines(0);

sp.DrawLineGraph(ydata,xdata);
Worked Examples
 |
 |
 |
 |