| Professional charting tools for .Net developers |
Introducing SharpPlot
Your First Chart
Recent Updates
Tutorials
General Tutorials
Chart Tutorials
Reference
SharpPlot Class
Properties
Methods
Structures
Enumerations
Style examples
Glossaries
Active Charts
VectorMath Class
DBUtil Class
Get SharpPlot
Download SharpPlot
Buying SharpPlot
SharpPlot Support
Upgrading from GraPL
Release notes
Home > Sample Charts > LineGraph > A Typical Timeseries with Averaging
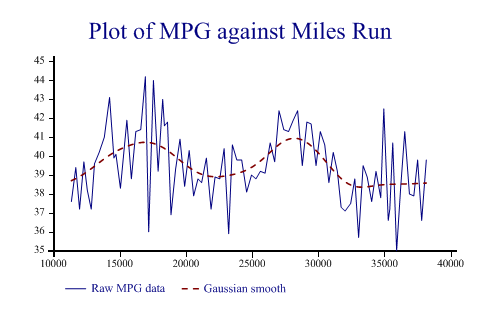
A Typical Timeseries with Averaging
SharpPlot offers several ways to smooth a typically noisy timeseries. You can use the ‘Trend’ style to add a gaussian-weighted moving average or you can use any combination of traditional smoothing methods. This example has the results of monitoring the fuel consumption of a typical family car (measured in miles per gallon of fuel) which has plenty of random variation and some clear cycles (probably winter and summer).
Note that the very first value is a ‘dud’ and is removed from the plot by setting it as ‘missing data’. In this case the fitted curve has been emphasised over the raw series by drawing it with a heavier line, on top of the data.
Of course you may have your own routines to compute more sophisticated curves and just add them to the chart with more calls to DrawLineGraph. A typical trick used when monitoring market data is to plot several moving averages and look for the point where they cross.
SharpPlot sp = new SharpPlot;

odo = new int[] {11061,11354,11689,11975,12300,12558,12856,13100,13455,13841,14239,
         14571,14721,15058,15546,15886,16220,16592,16944,17192,17552,17906,18252,
         18381,18611,18876,19224,19558,19907,20252,20584,20914,21188,21549,21901,
         22204,22563,22890,23232,23510,23847,24214,24589,24954,25291,25627,25977,
         26366,26708,27030,27396,27753,28107,28437,28792,29136,29459,29831,30153,
         30487,30796,31127,31440,31722,32018,32442,32755,33045,33385,33689,34031,
         34355,34715,34944,35281,35398,35618,35915,36225,36526,36878,37212,37496,
         37805,38152};
mpg = new double[] {0,37.6,39.4,37.2,39.7,38.2,37.2,39.6,40.2,41,43.1,39.9,40.1,
         38.3,41.9,38.8,41.3,41.4,44.2,36,44,39.2,43,41.6,41.8,36.9,39.3,40.9,38.4,
         40.3,37.9,38.8,38.6,39.9,37.2,38.9,38.8,40.4,35.9,40.6,39.8,39.8,38.1,39,
         38.8,39.2,39.1,40.7,39.7,42.4,41.4,41.3,41.9,42.4,39.5,41.8,41.7,39.5,41.3,
         40.6,38.6,40.2,39.2,37.3,37.1,37.5,38.8,35.7,39.5,38.9,37.6,39.2,37.8,42.5,
         36.6,37.2,40.7,35,38.4,41.3,38,37.9,39.8,36.6,39.8};

sp.Heading = "Plot of MPG against Miles Run";
sp.SetXTickMarks(5000);
sp.LineGraphStyle = LineGraphStyles.TrendLine|LineGraphStyles.OnTopModel;
sp.Flexibility = 5;
sp.MissingValue = 0;
sp.SetLineStyles(new LineStyle[]{LineStyle.Solid,LineStyle.Dash});
sp.SetPenWidths(new double[] {0.8,1.2});

sp.DrawLineGraph(mpg,odo);  // SharpPlot.DrawLineGraph

sp.SetKeyText(new string[]{"Raw MPG data","Gaussian smooth"});
Worked Examples
 |
 |
 |
 |