| Professional charting tools for .Net developers |
Introducing SharpPlot
Your First Chart
Recent Updates
Tutorials
General Tutorials
Chart Tutorials
Reference
SharpPlot Class
Properties
Methods
Structures
Enumerations
Style examples
Glossaries
Active Charts
VectorMath Class
DBUtil Class
Get SharpPlot
Download SharpPlot
Buying SharpPlot
SharpPlot Support
Upgrading from GraPL
Release notes
Home > Sample Charts > LineGraph > Mountain-range shading
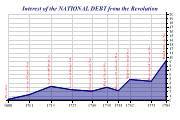
Mountain-range shading
Linegraphs are most commonly used to represent data which changes over time (stock prices or currency values are typical) but may be used wherever pairs of X and Y values are joined by lines. The default is to join the points with straight lines, but for some applications (for example illustrating a graph of Y-squared versus X) then it is better to use smooth curves.
Sometimes it is best to show the accumulated values of several series as a stack of shaded surfaces. SharpPlot will accumulate the series for you and shade the surfaces if required.
Note that any gradient fills are defined on the entire plotting region, so will always be consistently applied regardless of the range of the data. Clearly, you must pass all the series in the same call to have SharpPlot accumulate them for you in this way.
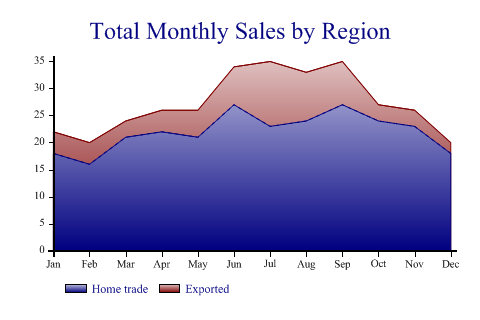
SharpPlot sp = new SharpPlot;

sp.Heading = "Total Monthly Sales by Region";

home = new int[] {18,16,21,22,21,27,23,24,27,24,23,18};
export = new int[] {4,4,3,4,5,7,12,9,8,3,3,2};
months = new int[] {1,2,3,4,5,6,7,8,9,10,11,12};

sp.LineGraphStyle = LineGraphStyles.SurfaceShading;
sp.DataStyle = DataStyles.Relative;
sp.YAxisStyle = YAxisStyles.ForceZero;
sp.SetXLabels(new string[]{"Jan","Feb","Mar","Apr","May","Jun","Jul","Aug","Sep",
         "Oct","Nov","Dec"});

sp.SetFillStyles(FillStyle.GradientBottom);
sp.SetPenWidths(0.1);

sp.DrawLineGraph(new int[][]{home,export},months);  // SharpPlot.DrawLineGraph
sp.SetKeyText(new string[]{"Home trade","Exported"});
Worked Examples
 |
 |
 |
 |