| Professional charting tools for .Net developers |
Introducing SharpPlot
Your First Chart
Recent Updates
Tutorials
General Tutorials
Chart Tutorials
Reference
SharpPlot Class
Properties
Methods
Structures
Enumerations
Style examples
Glossaries
Active Charts
VectorMath Class
DBUtil Class
Get SharpPlot
Download SharpPlot
Buying SharpPlot
SharpPlot Support
Upgrading from GraPL
Release notes
Home > Sample Charts > LineGraph
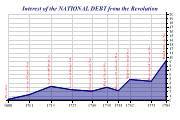
LineGraph
Linegraphs are most commonly used to represent data which changes over time (stock prices or currency values are typical) but may be used wherever pairs of X and Y values are joined by lines. The default is to join the points with straight lines, but for some applications (for example illustrating a graph of Y-squared versus X) then it is better to use smooth curves.
This chart has a wide variety of styles, for example it can draw risers from the X-axis, fill the surface, add arrowheads to the end of each line, and so on. These styles can be combined as required by calling DrawLineGraph several times with different style settings to overlay multiple charts on the same set of axes.
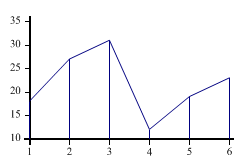
SharpPlot sp = new SharpPlot;
sp.SetMargins(12,12,18,4);
sp.LineGraphStyle = LineGraphStyles.Risers;
data = new int[] {18,27,31,12,19,23};
sp.DrawLineGraph(data);
Worked Examples
 |
 |
 |
 |