| Professional charting tools for .Net developers |
Introducing SharpPlot
Your First Chart
Recent Updates
Tutorials
General Tutorials
Chart Tutorials
Reference
SharpPlot Class
Properties
Methods
Structures
Enumerations
Style examples
Glossaries
Active Charts
VectorMath Class
DBUtil Class
Get SharpPlot
Download SharpPlot
Buying SharpPlot
SharpPlot Support
Upgrading from GraPL
Release notes
Home > Sample Charts > VennDiagram > Three Areas
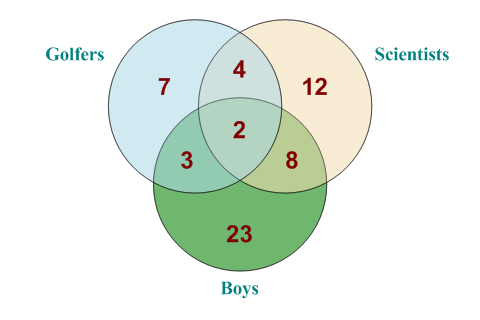
Three Areas
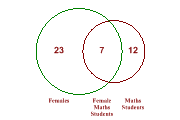
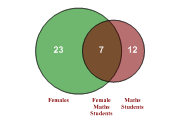
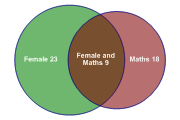
The Venn diagram shows a diagrammatic view of Set membership data, using the correct proportions for the easy case with 2 populations (and 1 overlap) and a simple diagram with intersecting circles for the 3-area case.
For the Three-area chart, it is essential to add the Value tags, as the size of the circles gives no clue to the number of members of each category.
Here we have 23 boys and 7 golfers. 3 of the boys play golf, and 2 of the golfing boys are scientists. For realistic data, some of the areas may have no members at all, but this does not affect the way the diagram is drawn.
SharpPlot sp = new SharpPlot;

data = AE.Join(new int[] {23,12,7},AE.Join(new int[] {8,4,3},2));
sp.SetMargins(12,12,6,6);

sp.VennDiagramStyle = VennDiagramStyles.Filled|VennDiagramStyles.RedrawOutline|
         VennDiagramStyles.ValueTags;

sp.SetValueFont("arial",18,FontStyle.Bold,Color.Maroon);

sp.ValueTagStyle = ValueTagStyles.Inside;
sp.ValueLineSpacing = 100;
sp.SetColors(new Color[]{Color.Green,Color.Wheat,Color.LightBlue});

sp.SetXLabels(new string[]{"Boys","Scientists","Golfers"});
sp.SetXLabelFont("times",14,FontStyle.Bold,Color.Teal);

sp.DrawVennDiagram(data);
Worked Examples
 |
 |
 |
 |