| Professional charting tools for .Net developers |
Introducing SharpPlot
Your First Chart
Recent Updates
Tutorials
General Tutorials
Chart Tutorials
Reference
SharpPlot Class
Properties
Methods
Structures
Enumerations
Style examples
Glossaries
Active Charts
VectorMath Class
DBUtil Class
Get SharpPlot
Download SharpPlot
Buying SharpPlot
SharpPlot Support
Upgrading from GraPL
Release notes
Home > Sample Charts > VennDiagram > A Simple 2-Area Diagram
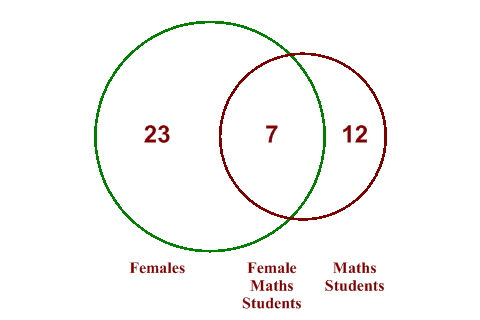
A Simple 2-Area Diagram
The Venn diagram shows a diagrammatic view of Set membership data, using the correct proportions for the simply case with 2 populations (and 1 overlap) and a simple diagram with intersecting circles for the 3-area case.
This is very typical of the type of data Venn diagrams are used for. We have a population of students, of which 12 study maths and 23 are girls. Of these, 7 study maths. The two circles are drawn with their areas in proportion to the size of each group, and the centres are placed so that the area of overlap represents the number in the intersection.
SharpPlot sp = new SharpPlot;

data = new int[] {23,12,7};
sp.SetMargins(12,48,0,0);
sp.VennDiagramStyle = VennDiagramStyles.ValueTags;
sp.SetValueFont("arial",18,FontStyle.Bold,Color.Maroon);

sp.SetColors(new Color[]{Color.Green,Color.Maroon});
sp.SetEdgeStyle(Color.Black,LineStyle.Solid,2);

sp.SetXLabels(new string[]{"Females","Maths Students","Female Maths Students"});
sp.SetXLabelFont("times",12,FontStyle.Bold,Color.Maroon);
sp.XLabelFormat = "XXXXXX;";

sp.DrawVennDiagram(data);
Worked Examples
 |
 |
 |
 |