| Professional charting tools for .Net developers |
Introducing SharpPlot
Your First Chart
Recent Updates
Sample Charts
Tutorials
General Tutorials
Chart Tutorials
SharpPlot Class
Properties
Structures
Enumerations
Style examples
Glossaries
Active Charts
VectorMath Class
DBUtil Class
Get SharpPlot
Download SharpPlot
Buying SharpPlot
SharpPlot Support
Upgrading from GraPL
Release notes
Reference > Methods > DrawVennDiagram Method
SharpPlot.DrawVennDiagram Method
Draw a Venn diagram using supplied membership data.
public void DrawVennDiagram(
    int[] regionValues
);
Example
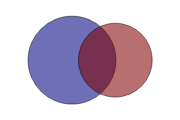
sp.SetMargins(12,12,4,4);
sp.VennDiagramStyle = VennDiagramStyles.Filled;
sp.DrawVennDiagram(new int[] {27,19,8});
The short tutorial has several more variations on the basic design.
Description
The Venn diagram shows a diagrammatic view of Set membership data, using the correct proportions for the simply case with 2 populations (and 1 overlap) and a simple diagram with intersecting circles for the 3-area case.
Only simple proportional (2-area) and diagrammatic (3-area) diagrams are supported.
See also ...
Using Venn diagrams | SharpPlot Members | VennDiagramStyle Property
