| Professional charting tools for .Net developers |
Introducing SharpPlot
Your First Chart
Recent Updates
Tutorials
General Tutorials
Chart Tutorials
Reference
SharpPlot Class
Properties
Methods
Structures
Enumerations
Style examples
Glossaries
Active Charts
VectorMath Class
DBUtil Class
Get SharpPlot
Download SharpPlot
Buying SharpPlot
SharpPlot Support
Upgrading from GraPL
Release notes
Home > Sample Charts > VennDiagram > Shading and Outlining
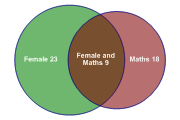
Shading and Outlining
The Venn diagram shows a diagrammatic view of Set membership data, using the correct proportions for the simply case with 2 populations (and 1 overlap) and a simple diagram with intersecting circles for the 3-area case.
When you choose to fill the circles, SharpPlot picks a suitable opacity setting so that the colours combine effectively. In this example the outline of each circle is redrawn over the filled areas.
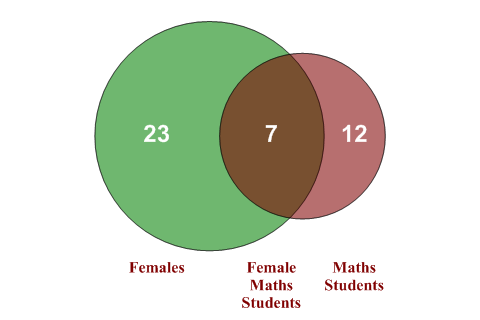
SharpPlot sp = new SharpPlot;

sp.SetMargins(12,48,0,0);
sp.VennDiagramStyle = VennDiagramStyles.Filled|VennDiagramStyles.RedrawOutline|
         VennDiagramStyles.ValueTags;
sp.SetValueFont("arial",18,FontStyle.Bold,Color.White);

sp.SetColors(new Color[]{Color.Green,Color.Maroon});
sp.SetXLabels(new string[]{"Females","Maths Students","Female Maths Students"});
sp.SetXLabelFont("times",12,FontStyle.Bold,Color.Maroon);
sp.XLabelFormat = "XXXXXX;";

sp.DrawVennDiagram(data);
Worked Examples
 |
 |
 |
 |