| Professional charting tools for .Net developers |
Introducing SharpPlot
Your First Chart
Recent Updates
Tutorials
General Tutorials
Chart Tutorials
Reference
SharpPlot Class
Properties
Methods
Structures
Enumerations
Style examples
Glossaries
Active Charts
VectorMath Class
DBUtil Class
Get SharpPlot
Download SharpPlot
Buying SharpPlot
SharpPlot Support
Upgrading from GraPL
Release notes
Home > Sample Charts > Table > Average Price by House Type
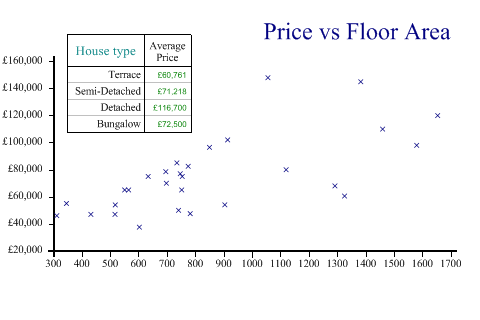
Average Price by House Type
Tables are often used very effectively in combination with other charts to add summarized information. For example a plot of a stock price might include a small table of the low and high values for the past year, and maybe a comparison with the industry sector.
This example adds a table of average prices to the house-price data used in the ScatterPlot tutorials. Another good use of a summary table would be to show the ‘count’ as a table to allow a quick check on the number of houses in each sample.
Note that the table is placed using the axis co-ordinates here. It can also be placed with absolute co-ordinates (given in points) and the table-width may be given as an optional 3rd argument to scale the table to fit the available space.
SharpPlot sp = new SharpPlot;

price = new int[] {60500,47500,46000,110000,148000,65000,79950,54000,120000,85000,
         65000,55000,70000,82500,78500,49950,46950,46950,77000,102000,37500,68000,
         65000,145000,98000,75000,96500,53950,75000};
area = new int[] {1326,782,312,1460,1056,752,1120,904,1654,735,565,346,698,775,696,
         741,432,517,747,914,603,1292,551,1383,1580,754,850,518,634};
housetype = new int[] {1,2,2,3,3,2,1,1,2,4,4,1,2,2,3,2,1,1,2,3,1,1,4,3,1,2,2,2,4};

sp.Heading = "Price vs Floor Area";
sp.HeadingStyle = HeadingStyles.Right;
sp.YLabelFormat = "£##,###,##0";

sp.DrawScatterPlot(price,area);

sp.GroupBy(housetype,new string[]{"Terrace","Semi-Detached","Detached","Bungalow"},
         GroupByFunction.Average);
sp.SetXLabels("Average\nPrice");
sp.YCaption = "House type";

sp.TableStyle = TableStyles.Boxed|TableStyles.GridLines|TableStyles.Opaque;
sp.ValueTagFormat = "£##,###,##0";

sp.SetTablePosition(350,180000);
sp.DrawTable(price);
Worked Examples
 |
 |
 |
 |