| Professional charting tools for .Net developers |
Introducing SharpPlot
Your First Chart
Recent Updates
Tutorials
General Tutorials
Chart Tutorials
Reference
SharpPlot Class
Properties
Methods
Structures
Enumerations
Style examples
Glossaries
Active Charts
VectorMath Class
DBUtil Class
Get SharpPlot
Download SharpPlot
Buying SharpPlot
SharpPlot Support
Upgrading from GraPL
Release notes
Home > Sample Charts > Table
Table
Tables are often used very effectively in combination with other charts to add summarized information. For example a plot of a stock price might include a small table of the low and high values for the past year, and maybe a comparison with the industry sector.
Tables in SharpPlot are often used in conjunction with Grouping and Splitting to create hierarchical summaries from raw database information. Spanned row-headers are often used to make the effect of the categorisation clear to the reader.
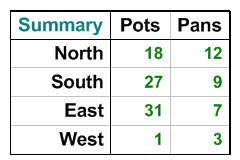
SharpPlot sp = new SharpPlot;
sp.SetMargins(0);
sp.DrawFrame();
tabledata = new int[][]{new int[]{18,27,31,1},new int[]{12,9,7,3}};  // Two Columns
sp.SetYLabels(new string[]{"North","South","East","West"});
sp.SetXLabels(new string[]{"Pots","Pans"});
sp.YCaption = "Summary";
sp.TableStyle = TableStyles.Boxed|TableStyles.GridLines|TableStyles.FitWidth;
sp.SetValueFont("ARB",10);
sp.SetLabelFont("ARB",11);
sp.SetCaptionFont("ARB",11);
sp.DrawTable(tabledata);
Worked Examples
 |
 |
 |
 |