| Professional charting tools for .Net developers |
Introducing SharpPlot
Your First Chart
Recent Updates
Sample Charts
Tutorials
General Tutorials
Chart Tutorials
SharpPlot Class
Properties
Structures
Enumerations
Style examples
Glossaries
Active Charts
VectorMath Class
DBUtil Class
Get SharpPlot
Download SharpPlot
Buying SharpPlot
SharpPlot Support
Upgrading from GraPL
Release notes
Reference > Methods > DrawTable Method
SharpPlot.DrawTable Method
Construct table from a set of columns (or rows) of data.
Example
sp.SetMargins(0);
sp.DrawFrame();
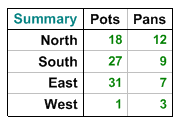
tabledata = new int[][]{new int[]{18,27,31,1},new int[]{12,9,7,3}};  // Two Columns
sp.SetYLabels(new string[]{"North","South","East","West"});
sp.SetXLabels(new string[]{"Pots","Pans"});
sp.YCaption = "Summary";
sp.TableStyle = TableStyles.Boxed|TableStyles.GridLines|TableStyles.FitWidth;
sp.SetValueFont("ARB",10);
sp.SetLabelFont("ARB",11);
sp.SetCaptionFont("ARB",11);
sp.DrawTable(tabledata);
The short tutorial shows a few of the possibilities and some sample code.
Overloads
- public void DrawTable(int[] data);
- public void DrawTable(string[] data);
- public void DrawTable(double[] data);
- public void DrawTable(int[][] data);
- public void DrawTable(double[][] data);
- public void DrawTable(string[][] tabledata);
Description
Tables are often used very effectively in combination with other charts to add summarized information. For example a plot of a stock price might include a small table of the low and high values for the past year, and maybe a comparison with the industry sector.
Tables in SharpPlot are often used in conjunction with Grouping and Splitting to create hierarchical summaries from raw database information. Spanned row-headers are often used to make the effect of the categorisation clear to the reader.
By default, arrays of arrays are taken as columns of items, but if it is more convenient this can be changed around by setting the DataStyle to Rows. If the data is already summarised and formatted, you can pass arrays of strings rather than numeric values here.
Stand-alone Tables
If you call sp.DrawTable directly in a new frame (or a new cell in a trellis) it checks for any of the heading, subhead and footnote and decorates the table appropriately. If you add a table to an existing chart (effectively using it as a structured note) these settings are ignored by default. You can have them picked up by setting the UseHeaders style.
See also ...
Tabulating data | SharpPlot Members | DataStyle Property | TableStyle Property
