| Professional charting tools for .Net developers |
Introducing SharpPlot
Your First Chart
Recent Updates
Tutorials
General Tutorials
Chart Tutorials
Reference
SharpPlot Class
Properties
Methods
Structures
Enumerations
Style examples
Glossaries
Active Charts
VectorMath Class
DBUtil Class
Get SharpPlot
Download SharpPlot
Buying SharpPlot
SharpPlot Support
Upgrading from GraPL
Release notes
Home > Sample Charts > StepChart > Rainfall Totals by Month
Rainfall Totals by Month
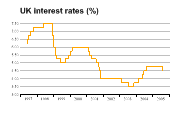
Stepcharts are used for two main purposes – timeseries where the values change discontinuously (interest rates are typical) and summary data where the groups are of variable width (monthly totals). SharpPlot can draw the steps with risers from the X-axis (which has the effect of abutted bars) and with shading down to either the axis or a given reference line.
The Stepchart is ideal for showing aggregated data where the groups have varying widths (in this case the months are quite similar, but we should still be honest about February). Monthly totals are written using value-tags on the top of each block.
Note that the month boundaries have been used for the step-points and also to set the tick-marks for the X-axis.
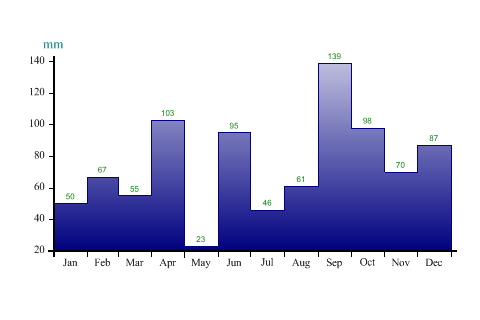
SharpPlot sp = new SharpPlot;

months = new int[] {0,31,59,90,120,151,181,212,243,273,304,334,365};
monthnames = new string[]{"Jan","Feb","Mar","Apr","May","Jun","Jul","Aug","Sep",
         "Oct","Nov","Dec"};
rudland = new int[] {50,67,55,103,23,95,46,61,139,98,70,87};

sp.StepChartStyle = StepChartStyles.SurfaceShading|StepChartStyles.ValueTags;
sp.SetXTickMarks(months);
sp.XAxisStyle = XAxisStyles.MiddleLabels;
sp.SetXLabels(monthnames);
sp.YAxisStyle = YAxisStyles.AtEndCaption;
sp.YCaption = "mm";

sp.SetFillStyles(FillStyle.GradientBottom);

sp.DrawStepChart(rudland,months);
Worked Examples
 |
 |
 |
 |