| Professional charting tools for .Net developers |
Introducing SharpPlot
Your First Chart
Recent Updates
Tutorials
General Tutorials
Chart Tutorials
Reference
SharpPlot Class
Properties
Methods
Structures
Enumerations
Style examples
Glossaries
Active Charts
VectorMath Class
DBUtil Class
Get SharpPlot
Download SharpPlot
Buying SharpPlot
SharpPlot Support
Upgrading from GraPL
Release notes
Home > Sample Charts > StepChart > Budget as a Backcloth
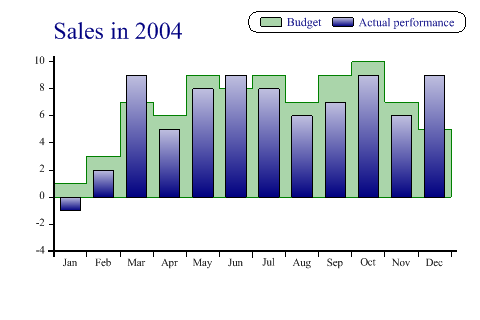
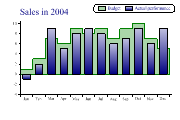
Budget as a Backcloth
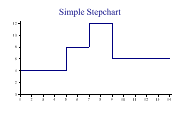
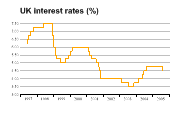
Stepcharts are used for two main purposes – timeseries where the values change discontinuously (interest rates are typical) and summary data where the groups are of variable width (monthly totals). SharpPlot can draw the steps with risers from the X-axis (which has the effect of abutted bars) and with shading down to either the axis or a given reference line.
This example combines a Stepchart with a standard Barchart to show the annual budget as a backdrop to the actual sales figures by month. In this case, the months all have a ‘notional’ width so no x-axis need be given for the steps.
Note the use of a ‘baseline’ here to have the shading and bars drawn outwards from the zero-line rather than from the X-axis. The chart has been given an explicit Y-range to allow space for the extremes from both series.
SharpPlot sp = new SharpPlot;

budget = new int[] {1,3,7,6,9,8,9,7,9,10,7,5,5};
actual = new int[] {-1,2,9,5,8,9,8,6,7,9,6,9};

sp.Heading = "Sales in 2004";
sp.HeadingStyle = HeadingStyles.Left;

sp.SetColors(new Color[]{Color.Green,Color.Navy});
sp.SetFillStyles(new FillStyle[]{FillStyle.Halftone,FillStyle.GradientBottom});

sp.SetYRange(-3,10);
sp.Baseline = 0;

sp.XAxisStyle = XAxisStyles.MiddleLabels;
sp.SetXLabels(monthnames);

sp.StepChartStyle = StepChartStyles.SurfaceShading;

sp.DrawStepChart(budget);  // see Stepsuite

sp.DrawBarChart(actual);

sp.SetKeyText(new string[]{"Budget","Actual performance"});
sp.KeyStyle = KeyStyles.TopAlign|KeyStyles.RightAlign|KeyStyles.Boxed|KeyStyles.Rounded;
Worked Examples
 |
 |
 |
 |