| Professional charting tools for .Net developers |
Introducing SharpPlot
Your First Chart
Recent Updates
Tutorials
General Tutorials
Chart Tutorials
Reference
SharpPlot Class
Properties
Methods
Structures
Enumerations
Style examples
Glossaries
Active Charts
VectorMath Class
DBUtil Class
Get SharpPlot
Download SharpPlot
Buying SharpPlot
SharpPlot Support
Upgrading from GraPL
Release notes
Home > Sample Charts > PieChart > A Basic Pie with Spider Tags
A Basic Pie with Spider Tags
The Piechart is typically used to show how some total value is divided up, for example sales in two or more regions. It works best when there are only a few values, and they should be ranked in numerical order to facilitate comparison of the sector sizes. This example shows a piechart with most of the options left to default.
Note that SharpPlot treats piecharts as if they have an ‘x-axis’ so this example uses X-labels and wraps them with an X-axis formatter. The chart allows ‘reasonable’ headspace for the labels (within the chart margins) but it may be necessary to adjust either the positioning or radius of the pie if there is a lot of long label text.
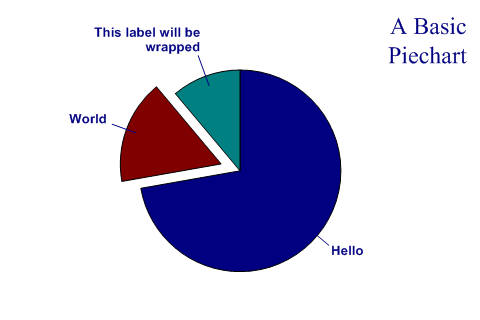
SharpPlot sp = new SharpPlot;
sp.SetMargins(16,0,6,6);
sp.Heading = "A Basic\nPiechart";
sp.HeadingStyle = HeadingStyles.Right;

sp.SetXLabels(new string[]{"Hello","World","This label will be wrapped"});
sp.SetLabelFont("Arial",10,FontStyle.Bold,Color.Navy);
sp.XLabelFormat = "XXXXXXXXXXXXXX;";
sp.DrawPieChart(new int[]{13,3,2},new int[]{0,20,0});
Worked Examples
 |
 |
 |
 |