| Professional charting tools for .Net developers |
Introducing SharpPlot
Your First Chart
Recent Updates
Sample Charts
Tutorials
General Tutorials
Chart Tutorials
SharpPlot Class
Properties
Structures
Enumerations
Style examples
Glossaries
Active Charts
VectorMath Class
DBUtil Class
Get SharpPlot
Download SharpPlot
Buying SharpPlot
SharpPlot Support
Upgrading from GraPL
Release notes
Reference > Methods > DrawPieChart Method
SharpPlot.DrawPieChart Method
Constructs a piechart from an array of data values and optional segment explosions.
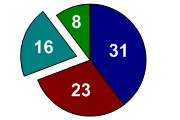
Example
sp.SetMargins(0);
sp.PieChartStyle = PieChartStyles.ValueTags;
sp.ValueTagStyle = ValueTagStyles.Inside;
sp.SetValueFont("Arial",18,FontStyle.Bold,Color.White);
data = new int[] {31,23,16,8};
expl = new int[] {0,0,25,0};
sp.DrawPieChart(data,expl);
The short tutorial shows a few of the possibilities and some sample code.
Overloads
- public void DrawPieChart(int[] data);
- public void DrawPieChart(double[] data);
- public void DrawPieChart(int[] data,int[] explode);
- public void DrawPieChart(double[] data,int[] explode);
Description
The Piechart is typically used to show how some total value is divided up, for example sales in two or more regions. It works best when there are only a few values, and they should be ranked in numerical order to facilitate comparison of the sctor sizes. Pies are often labelled with the actual values in the sectors, and one or more sectors may be ‘exploded’ to emphasise certain values.
If there are more than 5 or 6 values, and it is important for the user to be able to compare values accurately, the simple Barchart is almost always a better format.
See also ...
Using Piecharts | SharpPlot Members | PieChartStyle Property