| Professional charting tools for .Net developers |
Introducing SharpPlot
Your First Chart
Recent Updates
Tutorials
General Tutorials
Chart Tutorials
Reference
SharpPlot Class
Properties
Methods
Structures
Enumerations
Style examples
Glossaries
Active Charts
VectorMath Class
DBUtil Class
Get SharpPlot
Download SharpPlot
Buying SharpPlot
SharpPlot Support
Upgrading from GraPL
Release notes
Home > Sample Charts > TowerChart > A Simple Towerchart from Arrays of Data
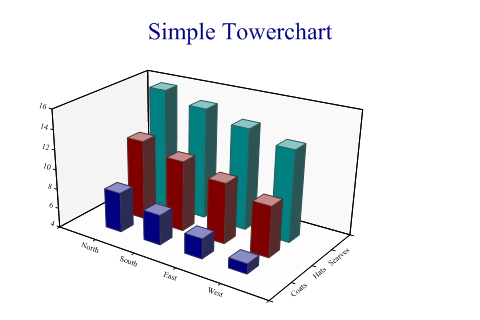
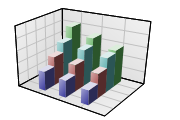
A Simple Towerchart from Arrays of Data
Towercharts are simply grouped barcharts with the bars drawn ‘behind’ each other rather than in groups along the X-axis. They are best used where the visual effect is more important than the readability of the data values, as it is almost impossible to read the ‘height’ values reliably, and it is very likely that in a crowded chart some towers will be completely obscured.
SharpPlot expects the data as an array of arrays of values – each inner array is plotted parallel to the X-axis and they work back towards the backplane. This means that they are best drawn with the smaller values in the earlier arrays, each of which is itself arranged from larger to smaller values – this way the towers are less likely to hide each other.
Note that both the X and Y axes simply display the towers in sequence – there is no equivalent of XBarchart available here to allow towers to be placed in specific places on the XY grid. The axes will be automatically labelled with the tower number unless you give your own labels (as here).
SharpPlot sp = new SharpPlot;

towers = new int[][]{new int[]{8,7,6,5},new int[]{12,11,10,9},new int[]{16,15,14,13}};

sp.SetMargins(48,12,24,0);

sp.Heading = "Simple Towerchart";
sp.SetXLabels(new string[]{"North","South","East","West"});
sp.SetYLabels(new string[]{"Coats","Hats","Scarves"});

sp.TowerChartStyle = TowerChartStyles.WallShading;

sp.DrawTowerChart(towers);
Worked Examples
 |
 |
 |
 |