| Professional charting tools for .Net developers |
Introducing SharpPlot
Your First Chart
Recent Updates
Tutorials
General Tutorials
Chart Tutorials
Reference
SharpPlot Class
Properties
Methods
Structures
Enumerations
Style examples
Glossaries
Active Charts
VectorMath Class
DBUtil Class
Get SharpPlot
Download SharpPlot
Buying SharpPlot
SharpPlot Support
Upgrading from GraPL
Release notes
Home > Sample Charts > ResponsePlot > A Simple Mesh Surface
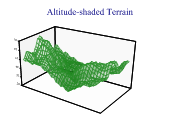
A Simple Mesh Surface
This chart is almost always used to illustrate a computed mathematical surface, and could often be combined with a Cloudchart to show a theoretical model overlayed with raw data values.
In the simplest case it takes a rectangular array of arrays of Z-values (effectively a matrix) and treats these as a uniform mesh to be plotted vertically with equally spaced x and y values. An option is to provide either or both of the x and x values as arrays of the correct length, to draw the mesh on a non-uniform scale.
The data shown here is an array of arrays of nodes in the surface, which must be strictly rectangular. Each inner array is drawn parallel to the X-axis, working from front to back.
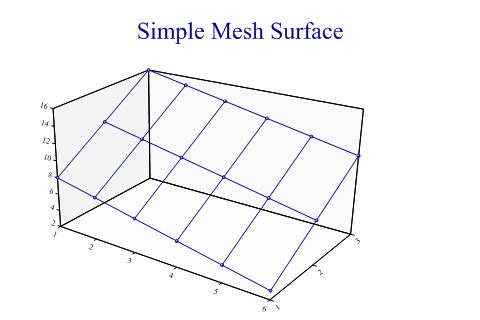
SharpPlot sp = new SharpPlot;

mesh = new int[][]{new int[]{8,7,6,5,4,3},new int[]{12,11,10,9,8,7},new int[]{16,15,
         14,13,12,11}};

sp.SetMargins(48,12,24,0);
sp.Heading = "Simple Mesh Surface";
sp.ResponsePlotStyle = ResponsePlotStyles.WallShading|ResponsePlotStyles.Markers;
sp.SetMarkers(Marker.Node);

sp.DrawResponsePlot(mesh);
Worked Examples
 |
 |
 |
 |