| Professional charting tools for .Net developers |
Introducing SharpPlot
Your First Chart
Recent Updates
Tutorials
General Tutorials
Chart Tutorials
Reference
SharpPlot Class
Properties
Methods
Structures
Enumerations
Style examples
Glossaries
Active Charts
VectorMath Class
DBUtil Class
Get SharpPlot
Download SharpPlot
Buying SharpPlot
SharpPlot Support
Upgrading from GraPL
Release notes
Home > Sample Charts > GanttChart > Plant Status Chart
Plant Status Chart
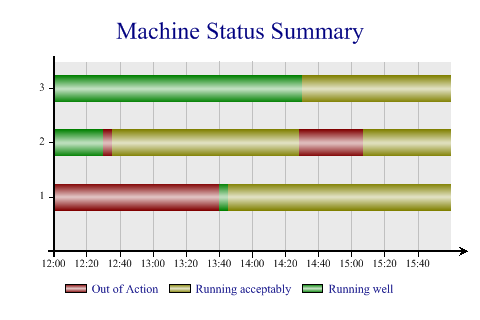
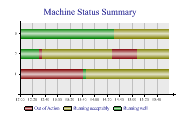
Gantt charts were originally devised as a graphical way to show the relationship between activites in a project plan, and have been made very popular by tools such as MS Project. The chart shows time progressing from left to right, with each activity drawn as a colored bar, and generally labelled with its name. This final chart uses the Gantt style to show historical performance rather than a schedule. The times are given as decimal parts of the day – see DateTime.ToOADate in the .Net framework for the conversion from DateTime objects.
Assuming the state information is complete, each bar will be continous across time, and will show colored bands corresponding to the state of each machine during that period. The gradient fill looks quite good here, but obviously adds no extra information and makes the saved chart a little larger in any of the raster formats.
SharpPlot sp = new SharpPlot;

ydata = new int[] {1,2,2,1,2,2,3,1,2,3};
starttime = new double[] {0.5,0.52083,0.60278,0.57291,0.5243,0.62986,0.6041,0.5694,0.5,0.5};
endtime = new double[] {0.5694,0.5243,0.62986,0.6667,0.6028,0.6667,0.6667,0.57291,
         0.52083,0.6041};
// Colours are allocated by state
state = new int[] {2,2,2,3,3,3,3,1,1,1};
sp.Heading = "Machine Status Summary";
sp.SetChartBackground(Color.Silver,FillStyle.Halftone);
sp.SetColors(new Color[]{Color.Maroon,Color.Olive,Color.Green});
sp.SetFillStyles(FillStyle.Pipe);
sp.XAxisStyle = XAxisStyles.Time|XAxisStyles.GridLines|XAxisStyles.ArrowedAxis;
sp.YAxisStyle = YAxisStyles.ExactFit;
sp.SetYRange(0,3.5);  // Space above top bar
sp.SetYTickMarks(1);
sp.SetXRange(12,16);  // Lunchtime to 16:00
sp.BarEdgeNib = 0;
sp.YLabelFormat = "##";  // Eliminate zero
sp.SetKeyText(new string[]{"Out of Action","Running acceptably","Running well"});
sp.SplitBy(state);

sp.SetBarWidths(0.5);
sp.DrawGanttChart(ydata,starttime,endtime);
Worked Examples
 |
 |
 |
 |