| Professional charting tools for .Net developers |
Introducing SharpPlot
Your First Chart
Recent Updates
Sample Charts
Tutorials
General Tutorials
Chart Tutorials
SharpPlot Class
Properties
Methods
Structures
Enumerations
Glossaries
Active Charts
VectorMath Class
DBUtil Class
Get SharpPlot
Download SharpPlot
Buying SharpPlot
SharpPlot Support
Upgrading from GraPL
Release notes
Reference > Style examples > Axis range is not taken to the next major tickmark
Axis range is not taken to the next major tickmark
By default SharpPlot rounds the scale to a major tickmark interval in both directions. If these ticks are well spaced out (for example annual data with 11 minor ticks at the month boundaries) it is often better just to span the range of the data.
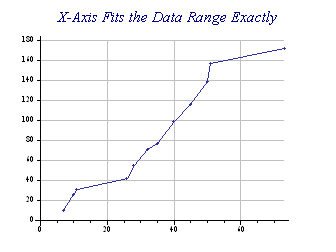
sp.SetXTickMarks(20,3);
sp.Heading = "X-Axis Fits the Data Range Exactly";
sp.XAxisStyle = XAxisStyles.ForceZero|XAxisStyles.ExactFit;
sp.DrawLineGraph(col_S1,col_S2);
This style is currently only available on the X-axis. It is often coupled with ForceZero (as here) to make the lower value round back nicely.