| Professional charting tools for .Net developers |
Introducing SharpPlot
Your First Chart
Recent Updates
Tutorials
General Tutorials
Chart Tutorials
Reference
SharpPlot Class
Properties
Methods
Structures
Enumerations
Style examples
Glossaries
Active Charts
VectorMath Class
DBUtil Class
Get SharpPlot
Download SharpPlot
Buying SharpPlot
SharpPlot Support
Upgrading from GraPL
Release notes
Home > Sample Charts > GanttChart > Categorised and Labelled Activities
Categorised and Labelled Activities
Gantt charts were originally devised as a graphical way to show the relationship between activites in a project plan, and have been made very popular by tools such as MS Project. The chart shows time progressing from left to right, with each activity drawn as a colored bar, and generally labelled with its name.
This example is very similar to the first chart, but labels the activities rather than the axis. The activities have been classified depending on status, and are drawn with the earliest at the top of the chart.
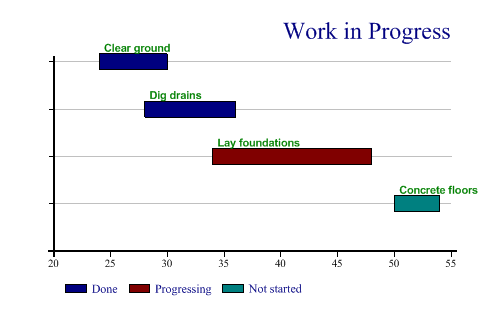
SharpPlot sp = new SharpPlot;

sp.Heading = "Work in Progress";
sp.HeadingStyle = HeadingStyles.Right;
todo = new string[]{"Clear ground","Dig drains","Lay foundations","Concrete floors"};
startwk = new int[] {24,28,34,50};
endwk = new int[] {30,36,48,54};
ydata = new int[] {4,3,2,1};
status = new string[]{"Done","Done","Progressing","Not started"};
sp.SetValueFont("Arial",8,FontStyle.Bold);
sp.SetValueTags(todo);
sp.GanttChartStyle = GanttChartStyles.ValueTags;
sp.YAxisStyle = YAxisStyles.ForceZero|YAxisStyles.GridLines|YAxisStyles.NoLabels;
sp.SetXTickMarks(5);
sp.SplitBy(status);
sp.DrawGanttChart(ydata,startwk,endwk);
Worked Examples
 |
 |
 |
 |