| Professional charting tools for .Net developers |
Introducing SharpPlot
Your First Chart
Recent Updates
Tutorials
General Tutorials
Chart Tutorials
Reference
SharpPlot Class
Properties
Methods
Structures
Enumerations
Style examples
Glossaries
Active Charts
VectorMath Class
DBUtil Class
Get SharpPlot
Download SharpPlot
Buying SharpPlot
SharpPlot Support
Upgrading from GraPL
Release notes
Home > Sample Charts > BoxPlot > Double boxplot of barley data by farm and year
Double boxplot of barley data by farm and year
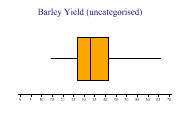
A selection of simple Box-and-Whisker charts are developed here, all using a ‘classic’ dataset from the 1930s showing barley yields at various farms in Canada. The trials were made at 6 farms over 2 years, with 10 varieties of barley, giving 120 data-points in total. The entire dataset is shown for reference in the glossary.
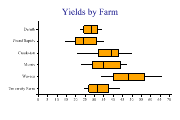
Rather than using the horizontal style, this chart takes another approach to the names, setting up a format string to force them to wrap nicely between the tickmarks on the X-axis.
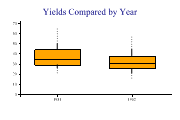
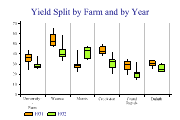
Interestingly, there were very big variations by year but they were very different at the different farms, so the simplistic split by year completely masked the effect. This style of chart makes the effect very clear indeed.

SharpPlot sp = new SharpPlot;

sp.Heading = "Yield Split by Farm and by Year";
sp.SetColors(new Color[]{Color.Orange,Color.GreenYellow});
sp.YAxisStyle = YAxisStyles.ForceZero;
sp.XAxisStyle = XAxisStyles.MiddleLabels|XAxisStyles.GridLines;
sp.BoxPlotStyle = BoxPlotStyles.TicksBetween;
sp.XLabelFormat = "XXXXXX;";
sp.DrawBoxPlot(yield,farm,years);
Worked Examples
 |
 |
 |
 |