| Professional charting tools for .Net developers |
Introducing SharpPlot
Your First Chart
Recent Updates
Tutorials
General Tutorials
Chart Tutorials
Reference
SharpPlot Class
Properties
Methods
Structures
Enumerations
Style examples
Glossaries
Active Charts
VectorMath Class
DBUtil Class
Get SharpPlot
Download SharpPlot
Buying SharpPlot
SharpPlot Support
Upgrading from GraPL
Release notes
Home > Sample Charts > MinMaxChart > A Typical Hi-Lo-Close Plot
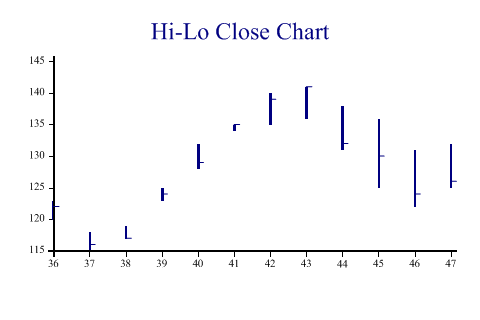
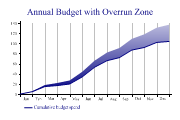
A Typical Hi-Lo-Close Plot
Some data series are best represented by their range at each time-value. Temperature data is typical – here the most informative chart shows the maximum and minimum values by day, with the range drawn as a vertical line. This chart is also commonly used for stock-price data where the daily high and low may be combined with opening and closing values to produce a wide variety of typical ‘Wall Street Journal’ plots of the market data.
There are many variations on this chart, but most of them come down to a combination of a MinMax and an overlayed scatterplot. The ‘LeftTick’ and ‘RightTick’ markers are specifically designed for this type of chart – you could additionally use a LeftTick to show the opening level if required.
SharpPlot sp = new SharpPlot;

hi = new int[] {123,118,119,125,132,135,140,141,138,136,131,132};
lo = new int[] {120,115,117,123,128,134,135,136,131,125,122,125};
close = new int[] {122,116,117,124,129,135,139,141,132,130,124,126};
wkno = new int[] {36,37,38,39,40,41,42,43,44,45,46,47};

sp.Heading = "Hi-Lo Close Chart";

sp.SetColors(Color.Navy);
sp.SetPenWidths(2);
sp.DrawMinMaxChart(hi,lo,wkno);  // SharpPlot.DrawMinMaxChart

sp.SetMarkers(Marker.RightTick);
sp.LineGraphStyle = LineGraphStyles.Markers|LineGraphStyles.NoLines;
sp.DrawLineGraph(close,wkno);
Worked Examples
 |
 |
 |
 |