| Professional charting tools for .Net developers |
Introducing SharpPlot
Your First Chart
Recent Updates
Sample Charts
Tutorials
General Tutorials
Chart Tutorials
SharpPlot Class
Properties
Structures
Enumerations
Style examples
Glossaries
Active Charts
VectorMath Class
DBUtil Class
Get SharpPlot
Download SharpPlot
Buying SharpPlot
SharpPlot Support
Upgrading from GraPL
Release notes
Reference > Methods > DrawBubbleChart Method
SharpPlot.DrawBubbleChart Method
Make an incidence plot from x and y data and marker scales.
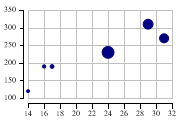
Example
sp.SetMargins(6,18,24,4);
sp.SetMarkers(Marker.Bullet);
ydata = new int[] {190,270,310,120,190,230};
xdata = new int[] {17,31,29,14,16,24};
count = new int[] {12,65,77,7,9,112};
sp.BubbleChartStyle = BubbleChartStyles.ExplodeAxes|BubbleChartStyles.GridLines;
sp.DrawBubbleChart(ydata,xdata,count);
The short tutorial shows a few of the possibilities and some sample code.
Overloads
- public void DrawBubbleChart(int[] yValues,int[] xValues,int[] markerArea);
- public void DrawBubbleChart(int[] yValues,int[] xValues,double[] markerArea);
- public void DrawBubbleChart(double[] yValues,double[] xValues,int[] markerArea);
- public void DrawBubbleChart(double[] yValues,double[] xValues,double[] markerArea);
Description
This chart is a variant of the standard ScatterPlot with the size of the markers used to show an extra dimension in the data. The third argument gives the required marker area (typically the number of incidents recorded at a certain location) and all the markers are automatically scaled to cover the range of areas given.
Any marker may be used here (including user-defined markers) but simple solid circles are probably best. See the tutorial for some more possibilities.
See also ...
More about Bubble Charts | SharpPlot Members | ScatterPlotStyle Property