| Professional charting tools for .Net developers |
Introducing SharpPlot
Your First Chart
Recent Updates
Sample Charts
General Tutorials
Reference
SharpPlot Class
Properties
Methods
Structures
Enumerations
Style examples
Glossaries
Active Charts
VectorMath Class
DBUtil Class
Get SharpPlot
Download SharpPlot
Buying SharpPlot
SharpPlot Support
Upgrading from GraPL
Release notes
Tutorials > Chart Tutorials > Triangle Plots for Proportions
Triangle Plots for Proportions
The Triangle chart is used to analyse data where there are three important constituents, summing to unity. It is common in Geology and Chemical Engineering where a set of 3 key ingredients determines the outcome from some process.
Plotting the Proportions of 3 values
alpha = new int[] {2,3,3};
bravo = new int[] {3,2,2};
charlie = new int[] {4,4,1};
sp.SetMargins(64,18,0,0);
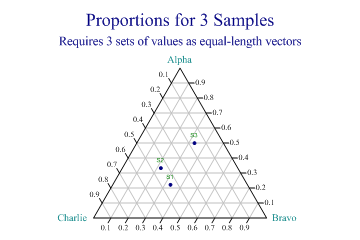
sp.Heading = "Proportions for 3 Samples";
sp.Subheading = "Requires 3 sets of values as equal-length vectors";
sp.TriangleStyle = (TriangleStyles.Markers|TriangleStyles.Labelled|TriangleStyles.ValueTags|TriangleStyles.GridLines);
sp.XCaption = "Alpha";
sp.YCaption = "Bravo";
sp.ZCaption = "Charlie";
sp.SetValueTags(new string[]{"S1","S2","S3"});
sp.SetMarkers(Marker.Bullet);
sp.DrawTriangle(alpha,bravo,charlie);
This chart shows the proportions of 3 constituents found in samples S1,S2 and S3. The allocation of series to chart axes is entirely arbitrary – the convention used is to work around clockwise from 12:00.
The natural data structure for this chart is a 3-column matrix, but an array of 3 data arrays (of equal lengths) is accepted.
Illustrating a Danger Zone
methane = new int[] {2,3,3,2,2};
oxygen = new int[] {3,2,2,4,3};
nitrogen = new int[] {4,4,2,2,4};
sp.SetMargins(42,12,0,0);
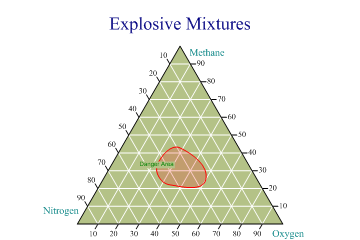
sp.Heading = "Explosive Mixtures";
sp.SetPenWidths(1.2);
sp.SetColors(Color.Red);
sp.SetFillStyles(FillStyle.Opacity18);
sp.TriangleStyle = (TriangleStyles.Lines|TriangleStyles.Curves|TriangleStyles.Labelled|
TriangleStyles.ValueTags|TriangleStyles.GridLines|TriangleStyles.Percentage|
TriangleStyles.Filled|TriangleStyles.SideCaptions);
sp.SetChartBackground(ColorTranslator.FromHtml("#B4C287"),FillStyle.Solid,0);
sp.SetGridLineStyle(Color.White,LineStyle.Solid,0.12);
sp.Flexibility = 12;
sp.XCaption = "Methane";
sp.YCaption = "Oxygen";
sp.ZCaption = "Nitrogen";
sp.SetValueTags(new string[]{"","Danger Area"});
sp.ValueTagStyle = (ValueTagStyles.Inside|ValueTagStyles.Opaque);
sp.DrawTriangle(new int[][]{methane,oxygen,nitrogen});
This is very typical of charts used in the chemical and oil industry, where certain combinations are either desirable or dangerous. Typically a chart such as this would be used as a basis, over which to plot a set of samples.
Note the use of ValueTags (only one is non-null) to label the outline.