| Professional charting tools for .Net developers |
Introducing SharpPlot
Your First Chart
Recent Updates
Sample Charts
Tutorials
General Tutorials
Chart Tutorials
SharpPlot Class
Properties
Methods
Structures
Enumerations
Glossaries
Active Charts
VectorMath Class
DBUtil Class
Get SharpPlot
Download SharpPlot
Buying SharpPlot
SharpPlot Support
Upgrading from GraPL
Release notes
Reference > Style examples > Lines are drawn between points
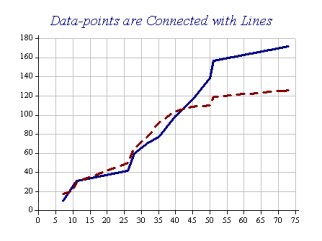
Lines are drawn between points
Lines are drawn between data-points on linegraphs and scatterplots. This is the default for linegraphs, so style ‘NoLines’ must be used to remove them.

sp.ScatterPlotStyle = ScatterPlotStyles.Lines;
Points are connected by straight lines unless the ‘Curves’ style is used. Use the ‘trend’ style to draw an approximate smooth curve through the data without visiting all the points.
See also ...
SharpPlot | BarChartStyle | BoxPlotStyle | CloudChartStyle | DialChartStyle | GanttChartStyle | LineGraphStyle | MinMaxChartStyle | PolarChartStyle | ResponsePlotStyle | ScatterPlotStyle | StepChartStyle | TableStyle | TowerChartStyle | TraceChartStyle | VennDiagramStyle | XAxisStyle | XBarChartStyle | YAxisStyle | ZAxisStyle | SetXDatumLines | SetYDatumLines | Curves | Trend